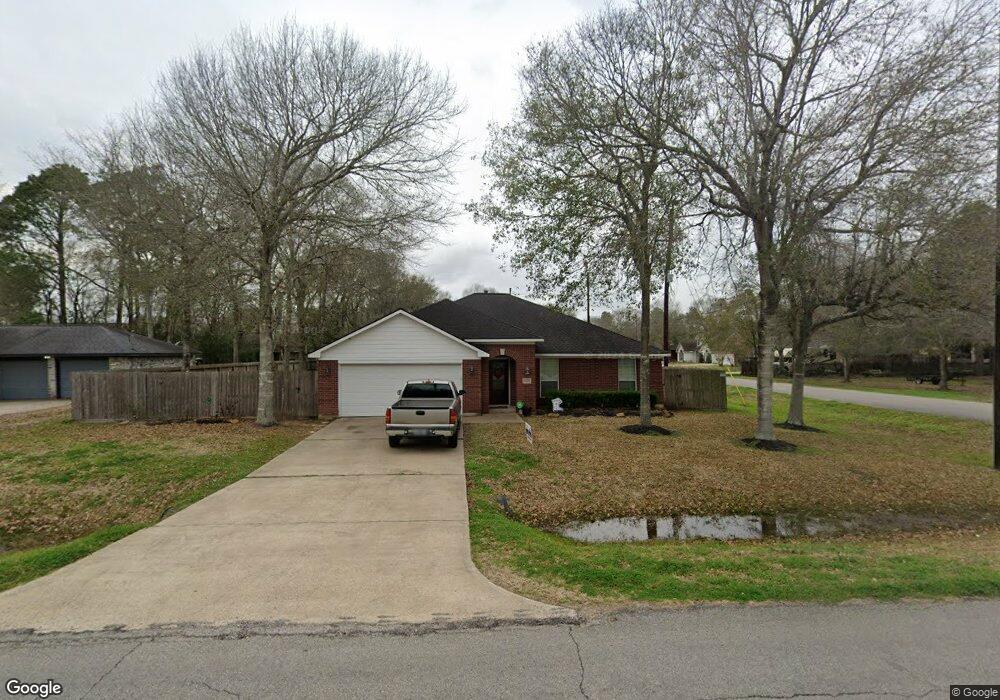
13202 Colony Rd Needville, TX 77461
Estimated Value: $284,969 - $356,000
3
Beds
2
Baths
1,720
Sq Ft
$183/Sq Ft
Est. Value
About This Home
This home is located at 13202 Colony Rd, Needville, TX 77461 and is currently estimated at $314,992, approximately $183 per square foot. 13202 Colony Rd is a home located in Fort Bend County with nearby schools including Needville Elementary School, Needville Junior High School, and Needville Middle School.
Ownership History
Date
Name
Owned For
Owner Type
Purchase Details
Closed on
Dec 8, 2003
Sold by
Trinity Manufacturing Inc
Bought by
Sanchez Gilbert R and Sanchez Patricia A
Current Estimated Value
Home Financials for this Owner
Home Financials are based on the most recent Mortgage that was taken out on this home.
Original Mortgage
$125,000
Outstanding Balance
$58,448
Interest Rate
6.01%
Mortgage Type
Purchase Money Mortgage
Estimated Equity
$256,544
Purchase Details
Closed on
Nov 26, 2002
Sold by
Falls Donald Dewayne and Falls Renee M
Bought by
Trinity Manufacturing Inc
Home Financials for this Owner
Home Financials are based on the most recent Mortgage that was taken out on this home.
Original Mortgage
$113,550
Interest Rate
6.28%
Create a Home Valuation Report for This Property
The Home Valuation Report is an in-depth analysis detailing your home's value as well as a comparison with similar homes in the area
Home Values in the Area
Average Home Value in this Area
Purchase History
| Date | Buyer | Sale Price | Title Company |
|---|---|---|---|
| Sanchez Gilbert R | -- | Startex Title | |
| Trinity Manufacturing Inc | -- | American Title Co | |
| Sanchez Gilbert R | -- | -- |
Source: Public Records
Mortgage History
| Date | Status | Borrower | Loan Amount |
|---|---|---|---|
| Open | Sanchez Gilbert R | $125,000 | |
| Previous Owner | Sanchez Gilbert R | $113,550 |
Source: Public Records
Tax History Compared to Growth
Tax History
| Year | Tax Paid | Tax Assessment Tax Assessment Total Assessment is a certain percentage of the fair market value that is determined by local assessors to be the total taxable value of land and additions on the property. | Land | Improvement |
|---|---|---|---|---|
| 2025 | $3,938 | $255,246 | $32,890 | $226,472 |
| 2024 | $3,938 | $232,042 | -- | $235,899 |
| 2023 | $3,938 | $210,947 | $0 | $217,888 |
| 2022 | $3,783 | $191,770 | $12,600 | $179,170 |
| 2021 | $3,930 | $174,340 | $25,300 | $149,040 |
| 2020 | $4,172 | $175,290 | $23,000 | $152,290 |
| 2019 | $4,416 | $172,140 | $23,000 | $149,140 |
| 2018 | $4,111 | $161,740 | $23,000 | $138,740 |
| 2017 | $3,938 | $154,370 | $19,000 | $135,370 |
| 2016 | $3,943 | $154,550 | $19,000 | $135,550 |
| 2015 | $3,504 | $157,580 | $19,000 | $138,580 |
| 2014 | $3,694 | $157,600 | $19,000 | $138,600 |
Source: Public Records
Map
Nearby Homes
- 14210 Cally Cir
- 0 Colony Rd
- 14238 Hay Meadow Ln
- 14234 Hay Meadow Ln
- 3819 Willow Breeze
- 14218 Golden Wheat Ln
- 10010 Texas 36
- 14218 Hay Meadow Ln
- 14214 Hay Meadow Ln
- 14235 Hay Meadow Ln
- 14231 Hay Meadow Ln
- 14222 Hay Meadow Ln
- 14239 Hay Meadow Ln
- 14227 Hay Meadow Ln
- 14226 Hay Meadow Ln
- 14230 Hay Meadow Ln
- 14624 Dove Ln
- 3002 Caroline St
- 3818 Founders Dr
- 3811 Candlewood Cir
- 13210 Colony Rd
- 13150 Colony Rd
- 14335 Cally CI
- 13211 Cary Ct
- 13218 Colony Rd
- 14335 Cally Cir
- 13219 Cary Ct
- 13144 Colony Rd
- 13226 Colony Rd
- 13221 Colony Rd
- 14327 Cally Cir
- 13203 Colony Rd
- 13202 Cary Ct
- 13210 Cary Ct
- 14319 Cally Cir
- 13136 Colony Rd
- 13218 Cary Ct
- 13226 Cary Ct
- 13135 Colony Rd
- 13211 Cortney Cir