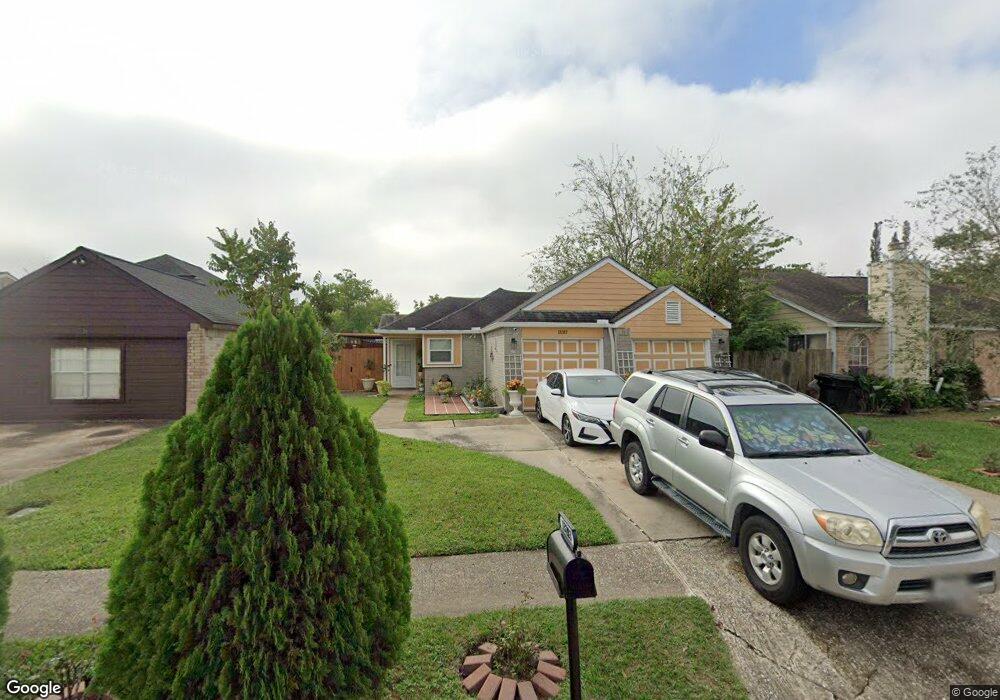
13203 Chimney Sweep Dr Houston, TX 77041
Hearthstone NeighborhoodEstimated Value: $197,000 - $247,000
3
Beds
2
Baths
1,107
Sq Ft
$193/Sq Ft
Est. Value
About This Home
This home is located at 13203 Chimney Sweep Dr, Houston, TX 77041 and is currently estimated at $213,589, approximately $192 per square foot. 13203 Chimney Sweep Dr is a home located in Harris County with nearby schools including Hairgrove Elementary School, Labay Middle School, and Cypress Falls High School.
Ownership History
Date
Name
Owned For
Owner Type
Purchase Details
Closed on
Sep 5, 2014
Sold by
Ocana Ramiro and Ocana Sandra
Bought by
Martinez Jose Guadalupe Hernandez and Lopez Maria Elizabeth Elizondo
Current Estimated Value
Home Financials for this Owner
Home Financials are based on the most recent Mortgage that was taken out on this home.
Original Mortgage
$80,000
Outstanding Balance
$61,155
Interest Rate
4.1%
Mortgage Type
New Conventional
Estimated Equity
$152,434
Purchase Details
Closed on
Aug 13, 1997
Sold by
Simmons Mary E
Bought by
Ocana Ramiro and Ocana Sandra
Home Financials for this Owner
Home Financials are based on the most recent Mortgage that was taken out on this home.
Original Mortgage
$42,650
Interest Rate
7.6%
Purchase Details
Closed on
Jan 5, 1994
Sold by
The Estate Of Floyd Oress Simmons
Bought by
Simmons Mary E
Create a Home Valuation Report for This Property
The Home Valuation Report is an in-depth analysis detailing your home's value as well as a comparison with similar homes in the area
Home Values in the Area
Average Home Value in this Area
Purchase History
| Date | Buyer | Sale Price | Title Company |
|---|---|---|---|
| Martinez Jose Guadalupe Hernandez | -- | None Available | |
| Ocana Ramiro | -- | American Title Co | |
| Simmons Mary E | -- | -- |
Source: Public Records
Mortgage History
| Date | Status | Borrower | Loan Amount |
|---|---|---|---|
| Open | Martinez Jose Guadalupe Hernandez | $80,000 | |
| Previous Owner | Ocana Ramiro | $42,650 |
Source: Public Records
Tax History Compared to Growth
Tax History
| Year | Tax Paid | Tax Assessment Tax Assessment Total Assessment is a certain percentage of the fair market value that is determined by local assessors to be the total taxable value of land and additions on the property. | Land | Improvement |
|---|---|---|---|---|
| 2025 | $1,987 | $199,954 | $71,689 | $128,265 |
| 2024 | $1,987 | $213,118 | $71,689 | $141,429 |
| 2023 | $1,987 | $198,095 | $51,518 | $146,577 |
| 2022 | $4,527 | $185,030 | $39,524 | $145,506 |
| 2021 | $4,352 | $154,822 | $39,524 | $115,298 |
| 2020 | $4,194 | $143,413 | $28,621 | $114,792 |
| 2019 | $3,962 | $135,886 | $20,228 | $115,658 |
| 2018 | $1,016 | $124,812 | $20,228 | $104,584 |
| 2017 | $3,286 | $113,087 | $20,228 | $92,859 |
| 2016 | $2,987 | $102,481 | $20,228 | $82,253 |
| 2015 | $1,857 | $89,726 | $13,410 | $76,316 |
| 2014 | $1,857 | $77,691 | $8,409 | $69,282 |
Source: Public Records
Map
Nearby Homes
- 7530 Lemma Dr
- 13215 Vista Oro Dr
- 13219 Vista Brook Dr
- 7635 Log Cradle Dr
- 13323 Firebrick Dr
- 13322 Chaston Dr
- 7402 Burkridge Dr
- 7511 Weatherhill Ln
- 13202 Chasworth Dr
- 7315 Weatherhill Ln
- 7607 Wovenwood Ln
- 13122 Eldridge Chase
- 7823 Autumn Hollow Ln
- 13814 Swan Hollow Ln
- 13811 Brannon Field Ln
- 13826 Swan Hollow Ln
- 7315 Millbrae Ln
- 7618 Mauna Kai Dr
- 8342 Cassidy Creek Ct
- 8303 Gros Ventre Ln
- 13207 Chimney Sweep Dr
- 13159 Chimney Sweep Dr
- 13211 Chimney Sweep Dr
- 13155 Chimney Sweep Dr
- 13206 Pebblewalk Cir N
- 13202 Pebblewalk Cir N
- 13210 Pebblewalk Cir N
- 13215 Chimney Sweep Dr
- 13214 Pebblewalk Cir N
- 13146 Pebblewalk Cir N
- 13151 Chimney Sweep Dr
- 13218 Pebblewalk Cir S
- 13202 Chimney Sweep Dr
- 13206 Chimney Sweep Dr
- 13218 Pebblewalk Cir N
- 13218 Pebblewalk Cir N
- 13142 Pebblewalk Cir N
- 13210 Chimney Sweep Dr
- 13219 Chimney Sweep Dr
- 13147 Chimney Sweep Dr