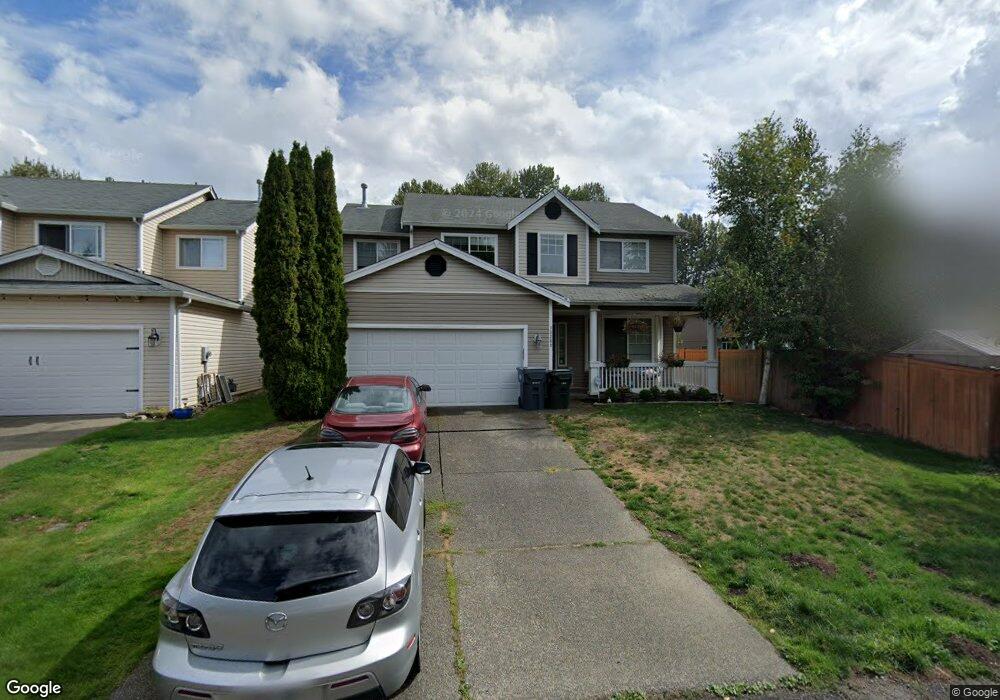
13209 89th Ave E Puyallup, WA 98373
Estimated Value: $525,712 - $544,000
4
Beds
3
Baths
1,980
Sq Ft
$269/Sq Ft
Est. Value
About This Home
This home is located at 13209 89th Ave E, Puyallup, WA 98373 and is currently estimated at $533,178, approximately $269 per square foot. 13209 89th Ave E is a home located in Pierce County with nearby schools including Zeiger Elementary School, Ballou Junior High School, and Gov. John Rogers High School.
Ownership History
Date
Name
Owned For
Owner Type
Purchase Details
Closed on
Jul 28, 2011
Sold by
Noll Kieth and Noll Marjorie
Bought by
Merwin Jacob P and Merwin Cheri R
Current Estimated Value
Home Financials for this Owner
Home Financials are based on the most recent Mortgage that was taken out on this home.
Original Mortgage
$199,980
Outstanding Balance
$138,011
Interest Rate
4.5%
Mortgage Type
FHA
Estimated Equity
$395,167
Purchase Details
Closed on
Jan 5, 2004
Sold by
Herzog Marcia A
Bought by
Noll Kieth and Noll Marjorie
Home Financials for this Owner
Home Financials are based on the most recent Mortgage that was taken out on this home.
Original Mortgage
$198,850
Interest Rate
6.02%
Mortgage Type
Purchase Money Mortgage
Purchase Details
Closed on
Sep 14, 1999
Sold by
Apple Development Homes Inc
Bought by
Herzog Marcia A
Home Financials for this Owner
Home Financials are based on the most recent Mortgage that was taken out on this home.
Original Mortgage
$172,900
Interest Rate
8.09%
Create a Home Valuation Report for This Property
The Home Valuation Report is an in-depth analysis detailing your home's value as well as a comparison with similar homes in the area
Home Values in the Area
Average Home Value in this Area
Purchase History
| Date | Buyer | Sale Price | Title Company |
|---|---|---|---|
| Merwin Jacob P | $220,000 | Old Republic Title Ltd | |
| Noll Kieth | $205,000 | Transnation Title Ins Co | |
| Herzog Marcia A | $213,220 | Chicago Title Insurance Co |
Source: Public Records
Mortgage History
| Date | Status | Borrower | Loan Amount |
|---|---|---|---|
| Open | Merwin Jacob P | $199,980 | |
| Previous Owner | Noll Kieth | $198,850 | |
| Previous Owner | Herzog Marcia A | $172,900 |
Source: Public Records
Tax History Compared to Growth
Tax History
| Year | Tax Paid | Tax Assessment Tax Assessment Total Assessment is a certain percentage of the fair market value that is determined by local assessors to be the total taxable value of land and additions on the property. | Land | Improvement |
|---|---|---|---|---|
| 2025 | $4,803 | $478,000 | $150,500 | $327,500 |
| 2024 | $4,803 | $468,100 | $147,100 | $321,000 |
| 2023 | $4,803 | $453,200 | $147,100 | $306,100 |
| 2022 | $4,794 | $463,700 | $165,000 | $298,700 |
| 2021 | $4,335 | $333,400 | $121,900 | $211,500 |
| 2019 | $3,749 | $305,900 | $100,400 | $205,500 |
| 2018 | $3,790 | $285,000 | $87,100 | $197,900 |
| 2017 | $3,479 | $257,700 | $75,000 | $182,700 |
| 2016 | $3,172 | $205,300 | $59,600 | $145,700 |
| 2014 | $2,863 | $195,100 | $51,500 | $143,600 |
| 2013 | $2,863 | $174,500 | $45,700 | $128,800 |
Source: Public Records
Map
Nearby Homes
- 8728 136th St E
- 9005 128th St E
- Stella Plan at Heritage Heights
- Hadley Plan at Heritage Heights
- Caymen Plan at Heritage Heights
- Warren Plan at Heritage Heights
- Asher Plan at Heritage Heights
- 9418 133rd St E
- 12911 83rd Avenue Ct E
- 8815 126th (Lot 32) Street Ct E
- 8709 126th (Lot 39) Street Ct E
- 8705 126th (Lot 40) Street Ct E
- 8710 126th (Lot 3) Street Ct E
- 8803 126th (Lot 35) Street Ct E
- 8804 St E
- 8719 126th (Lot 37) Street Ct E
- 8812 126th (Lot 8) Street Ct E
- 8808 126th (Lot 7) St E
- 8714 126th (Lot 4) St E
- 8812 126th St E
- 13205 89th Ave E
- 8911 133rd Street Ct E
- 8919 133rd Street Ct E
- 13201 89th Ave E
- 8923 133rd Street Ct E
- 8923 133rd St Ct E
- 8820 132nd St E
- 8819 133rd Street Ct E
- 8819 133rd St E
- 13139 89th Ave E
- 8816 132nd St E
- 13211 89th Avenue Ct E
- 13211 89th Ave Ct E
- 13211 89th Ave E
- 13217 89th Ave E
- 8815 133rd St E
- 8815 133rd Street Ct E
- 13133 89th Ave E
- 8916 133rd Street Ct E
- 8912 133rd Street Ct E