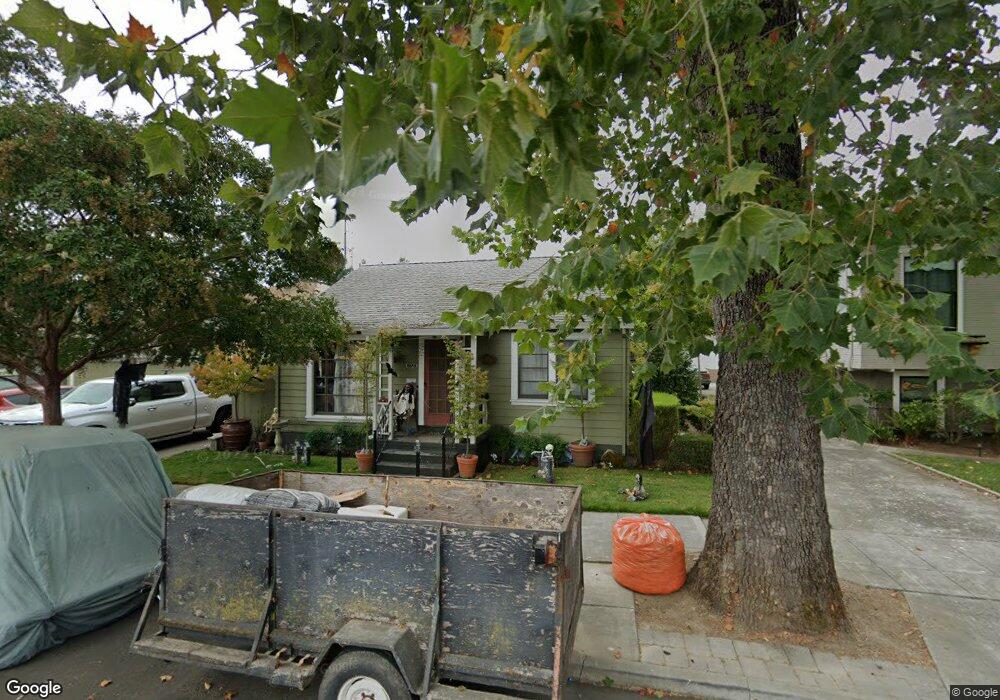
1321 B St Napa, CA 94559
Central Napa NeighborhoodEstimated Value: $933,000 - $1,033,000
4
Beds
3
Baths
2,218
Sq Ft
$448/Sq Ft
Est. Value
About This Home
This home is located at 1321 B St, Napa, CA 94559 and is currently estimated at $992,667, approximately $447 per square foot. 1321 B St is a home located in Napa County with nearby schools including Shearer Elementary School, Redwood Middle School, and Napa High School.
Ownership History
Date
Name
Owned For
Owner Type
Purchase Details
Closed on
Jan 18, 2008
Sold by
Fields Russell A
Bought by
Fields Russell A and Fields Kathy J
Current Estimated Value
Purchase Details
Closed on
Jan 16, 2008
Sold by
Callan Michael D
Bought by
Callan Michael D and Callan Dorothy A
Purchase Details
Closed on
Jan 8, 2008
Sold by
Revocab Callan John L and Revocab John B Ferrogiaro 2004
Bought by
Callan John L and Callan Michael D
Purchase Details
Closed on
Jul 27, 2004
Sold by
Ferrogiaro John
Bought by
Revocab Ferrogiaro John B and Revocab John B Ferrogiaro 2004
Create a Home Valuation Report for This Property
The Home Valuation Report is an in-depth analysis detailing your home's value as well as a comparison with similar homes in the area
Home Values in the Area
Average Home Value in this Area
Purchase History
We collect this data history from publicly available records. To have your information removed, we recommend requesting removal directly through your county’s website.
| Date | Buyer | Sale Price | Title Company |
|---|---|---|---|
| Fields Russell A | -- | None Available | |
| Callan Michael D | -- | None Available | |
| Callan John L | -- | None Available | |
| Callan John Louis | -- | None Available | |
| Revocab Ferrogiaro John B | -- | -- |
Source: Public Records
Tax History
| Year | Tax Paid | Tax Assessment Tax Assessment Total Assessment is a certain percentage of the fair market value that is determined by local assessors to be the total taxable value of land and additions on the property. | Land | Improvement |
|---|---|---|---|---|
| 2025 | $9,897 | $662,091 | $278,772 | $383,319 |
| 2024 | $9,633 | $649,109 | $273,306 | $375,803 |
| 2023 | $9,633 | $636,383 | $267,948 | $368,435 |
| 2022 | $9,248 | $623,906 | $262,695 | $361,211 |
| 2021 | $9,140 | $611,674 | $257,545 | $354,129 |
| 2020 | $9,084 | $605,403 | $254,905 | $350,498 |
| 2019 | $8,871 | $593,533 | $249,907 | $343,626 |
| 2018 | $8,705 | $581,896 | $245,007 | $336,889 |
| 2017 | $8,483 | $570,487 | $240,203 | $330,284 |
| 2016 | $8,189 | $559,302 | $235,494 | $323,808 |
| 2015 | $7,594 | $550,902 | $231,957 | $318,945 |
| 2014 | $7,470 | $540,112 | $227,414 | $312,698 |
Source: Public Records
Map
Nearby Homes
Your Personal Tour Guide
Ask me questions while you tour the home.