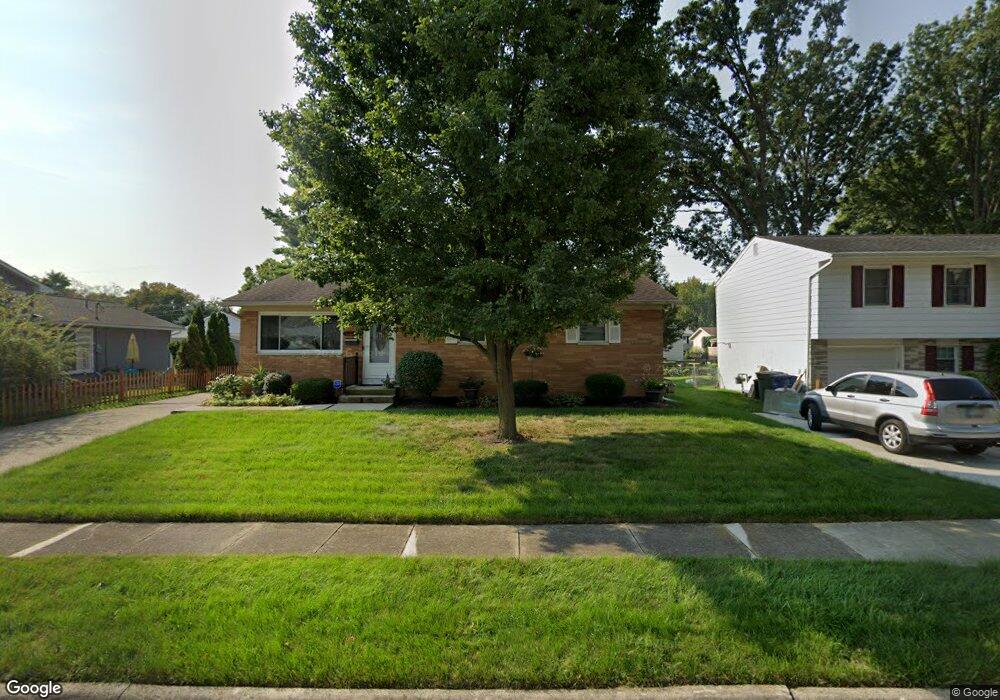
1321 Bosworth Square N Columbus, OH 43229
Devonshire NeighborhoodEstimated Value: $260,000 - $277,000
3
Beds
2
Baths
1,260
Sq Ft
$212/Sq Ft
Est. Value
About This Home
This home is located at 1321 Bosworth Square N, Columbus, OH 43229 and is currently estimated at $267,166, approximately $212 per square foot. 1321 Bosworth Square N is a home located in Franklin County with nearby schools including Devonshire Alternative Elementary School, Woodward Park Middle School, and Beechcroft High School.
Ownership History
Date
Name
Owned For
Owner Type
Purchase Details
Closed on
Aug 13, 2020
Sold by
Chapman Hayden E and Chapman Norma B
Bought by
Brodbeck Lynn C and The Chapman Preservation Trust
Current Estimated Value
Purchase Details
Closed on
Dec 17, 1965
Bought by
Chapman Hayden E
Create a Home Valuation Report for This Property
The Home Valuation Report is an in-depth analysis detailing your home's value as well as a comparison with similar homes in the area
Home Values in the Area
Average Home Value in this Area
Purchase History
| Date | Buyer | Sale Price | Title Company |
|---|---|---|---|
| Brodbeck Lynn C | -- | None Available | |
| Chapman Hayden E | -- | -- |
Source: Public Records
Tax History Compared to Growth
Tax History
| Year | Tax Paid | Tax Assessment Tax Assessment Total Assessment is a certain percentage of the fair market value that is determined by local assessors to be the total taxable value of land and additions on the property. | Land | Improvement |
|---|---|---|---|---|
| 2024 | $3,270 | $82,670 | $17,850 | $64,820 |
| 2023 | $3,257 | $82,670 | $17,850 | $64,820 |
| 2022 | $2,654 | $51,170 | $13,650 | $37,520 |
| 2021 | $2,204 | $51,170 | $13,650 | $37,520 |
| 2020 | $2,207 | $51,170 | $13,650 | $37,520 |
| 2019 | $1,935 | $40,640 | $10,920 | $29,720 |
| 2018 | $1,737 | $40,640 | $10,920 | $29,720 |
| 2017 | $1,817 | $40,640 | $10,920 | $29,720 |
| 2016 | $1,700 | $34,410 | $8,300 | $26,110 |
| 2015 | $1,543 | $34,410 | $8,300 | $26,110 |
| 2014 | $1,547 | $34,410 | $8,300 | $26,110 |
| 2013 | $876 | $38,220 | $9,205 | $29,015 |
Source: Public Records
Map
Nearby Homes
- 1294 Clydesdale Ct
- 1409 Bosworth Place
- 1322 Bolenhill Ct
- 1421 Bosworth Place
- 1268 Kildale Ct
- 6407 Faircrest Rd
- 6458 Faircrest Rd
- 1635 Tendril Ct
- 6342 Bellmeadow Dr
- 1288 Oakfield Dr N
- 6189 Northgap Dr
- 6211 Parkdale Dr
- 1460 Burnley Square N
- 1549 Alpine Dr
- 6407 Skywae Dr
- 1755 Hillandale Ave
- 1171 Newbury Dr
- 6035 Karl Rd
- 5990 Ambleside Dr
- 6355 Johnanne St
- 1313 Bosworth Square N
- 6581 Ambleside Dr
- 1320 Bosworth Square S
- 1301 Bosworth Square N
- 1312 Bosworth Square S
- 6565 Ambleside Dr
- 1304 Bosworth Square S
- 1322 Bosworth Square N
- 1314 Bosworth Square N
- 1330 Bosworth Square N
- 1293 Bosworth Square N
- 1306 Bosworth Square N
- 1351 Bosworth Place
- 1296 Bosworth Square S
- 1346 Bosworth Ct
- 1298 Bosworth Square N
- 6600 Ambleside Dr
- 1285 Bosworth Square N
- 1288 Bosworth Square S
- 1357 Bosworth Place