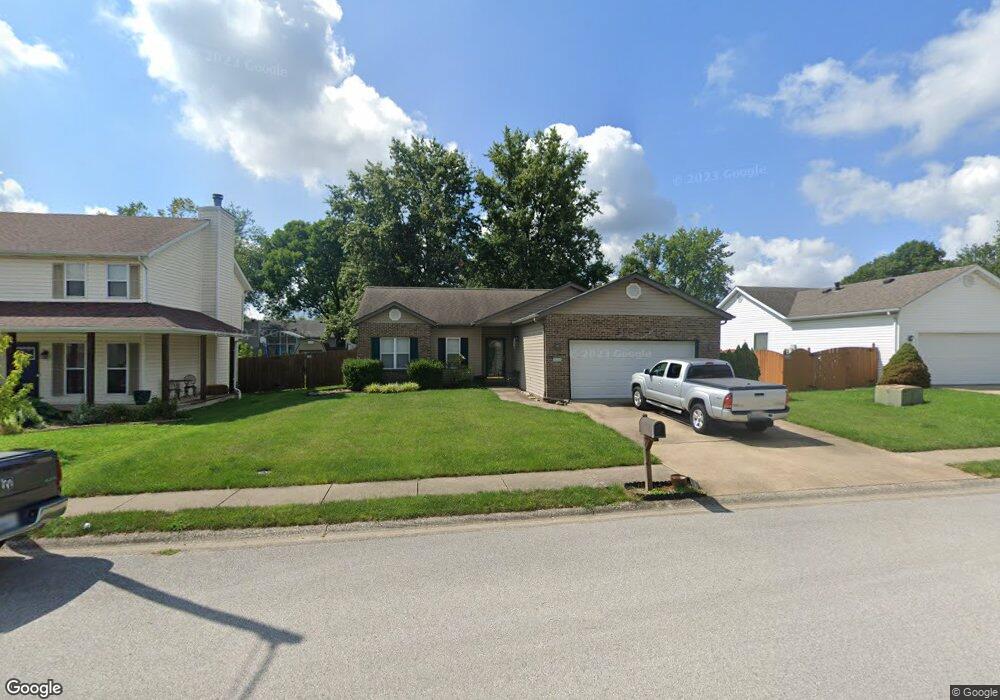
1321 Crown Ln O Fallon, IL 62269
Estimated Value: $229,073 - $276,000
--
Bed
--
Bath
1,363
Sq Ft
$189/Sq Ft
Est. Value
About This Home
This home is located at 1321 Crown Ln, O Fallon, IL 62269 and is currently estimated at $258,018, approximately $189 per square foot. 1321 Crown Ln is a home located in St. Clair County with nearby schools including Central Elementary School, Joseph Arthur Middle School, and O'Fallon Township High School.
Ownership History
Date
Name
Owned For
Owner Type
Purchase Details
Closed on
Jun 12, 2007
Sold by
Ham Matthew D and Ham Karen A
Bought by
Watson John D
Current Estimated Value
Purchase Details
Closed on
May 15, 2006
Sold by
Allen Michael
Bought by
Ham Matthew D and Ham Karen A
Home Financials for this Owner
Home Financials are based on the most recent Mortgage that was taken out on this home.
Original Mortgage
$127,200
Interest Rate
6.54%
Mortgage Type
Fannie Mae Freddie Mac
Purchase Details
Closed on
Mar 30, 2001
Sold by
Odaniel Whitney L and Odaniel Lisa Anne
Bought by
Kumming Robert W and Kumming Prudence C
Home Financials for this Owner
Home Financials are based on the most recent Mortgage that was taken out on this home.
Original Mortgage
$90,375
Interest Rate
7%
Mortgage Type
Purchase Money Mortgage
Create a Home Valuation Report for This Property
The Home Valuation Report is an in-depth analysis detailing your home's value as well as a comparison with similar homes in the area
Home Values in the Area
Average Home Value in this Area
Purchase History
| Date | Buyer | Sale Price | Title Company |
|---|---|---|---|
| Watson John D | $166,500 | Freedom Title | |
| Ham Matthew D | $159,000 | Freedom Title | |
| Kumming Robert W | $120,500 | -- |
Source: Public Records
Mortgage History
| Date | Status | Borrower | Loan Amount |
|---|---|---|---|
| Previous Owner | Ham Matthew D | $127,200 | |
| Previous Owner | Kumming Robert W | $90,375 | |
| Closed | Kumming Robert W | $24,100 |
Source: Public Records
Tax History Compared to Growth
Tax History
| Year | Tax Paid | Tax Assessment Tax Assessment Total Assessment is a certain percentage of the fair market value that is determined by local assessors to be the total taxable value of land and additions on the property. | Land | Improvement |
|---|---|---|---|---|
| 2024 | $2,213 | $62,826 | $11,146 | $51,680 |
| 2023 | $2,385 | $55,588 | $9,862 | $45,726 |
| 2022 | $2,357 | $49,434 | $9,667 | $39,767 |
| 2021 | $2,447 | $46,919 | $9,175 | $37,744 |
| 2020 | $2,476 | $44,444 | $8,691 | $35,753 |
| 2019 | $2,525 | $44,444 | $8,691 | $35,753 |
| 2018 | $2,556 | $45,028 | $9,292 | $35,736 |
| 2017 | $2,597 | $43,201 | $8,915 | $34,286 |
| 2016 | $2,625 | $42,226 | $8,714 | $33,512 |
| 2014 | $2,674 | $44,101 | $10,352 | $33,749 |
| 2013 | $3,244 | $44,914 | $10,543 | $34,371 |
Source: Public Records
Map
Nearby Homes
- 762 Kelley Dr
- 906 Powell Dr
- 210 Meadowbrook Dr
- 208 Ellen Ln
- 1230 Three Rivers Dr Unit 6B
- 509 Long Dr
- 205 Belt Ave
- 128 Alice Dr
- 1072 Cromwell Ln
- 5025 Bristol Hill Dr
- 894 Misty Valley Rd
- 2268 Haverford Dr
- 1433 Victoria Square Ct
- 1453 Winchester Grove Ct
- 21 Faith Dr
- 18 Del Ray Dr
- 2 Catalina Dr
- 1214 Carleton Ln
- 2024 Ravenel
- 215 Eagle Ridge Unit 215
- 1315 Crown Ln
- 1327 Crown Ln
- 1320 Terrace Green Ln
- 1326 Terrace Green Ln
- 1314 Terrace Green Ln
- 1333 Crown Ln
- 1309 Crown Ln
- 1322 Crown Ln
- 1332 Terrace Green Ln
- 1316 Crown Ln
- 1328 Crown Ln
- 1308 Terrace Green Ln
- 1339 Crown Ln
- 1334 Crown Ln
- 1310 Crown Ln
- 1338 Terrace Green Ln
- 1340 Crown Ln
- 1345 Crown Ln
- 1319 Terrace Green Ln
- 1325 Terrace Green Ln