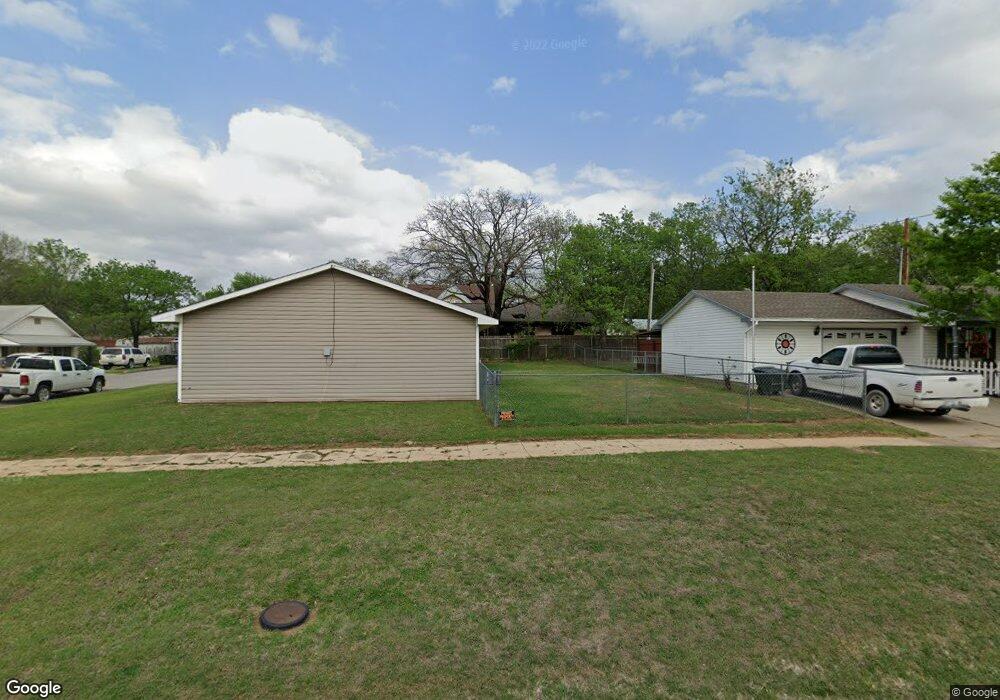
1321 Division St Sulphur, OK 73086
Estimated Value: $122,000 - $124,000
2
Beds
2
Baths
1,192
Sq Ft
$103/Sq Ft
Est. Value
About This Home
This home is located at 1321 Division St, Sulphur, OK 73086 and is currently estimated at $122,900, approximately $103 per square foot. 1321 Division St is a home located in Murray County with nearby schools including Sulphur Elementary School, Sulphur Intermediate School, and Sulphur Middle School.
Ownership History
Date
Name
Owned For
Owner Type
Purchase Details
Closed on
Sep 12, 2007
Sold by
04 Contractors Inc
Bought by
Oxley Tony G
Current Estimated Value
Home Financials for this Owner
Home Financials are based on the most recent Mortgage that was taken out on this home.
Original Mortgage
$77,811
Outstanding Balance
$12,135
Interest Rate
6.66%
Mortgage Type
Purchase Money Mortgage
Estimated Equity
$110,765
Purchase Details
Closed on
Apr 20, 2006
Sold by
Oxley Jessie and Oxley Rohonda E
Bought by
04 Contractors Inc
Home Financials for this Owner
Home Financials are based on the most recent Mortgage that was taken out on this home.
Original Mortgage
$73,763
Interest Rate
6.33%
Mortgage Type
Construction
Purchase Details
Closed on
Oct 26, 2004
Sold by
Mcclain Diane
Bought by
Oxley Jessie and Oxley Rhonda
Purchase Details
Closed on
Oct 13, 1995
Sold by
Hickman Ralph and Hickman Christi
Bought by
Wade Alene and Wade Rex
Create a Home Valuation Report for This Property
The Home Valuation Report is an in-depth analysis detailing your home's value as well as a comparison with similar homes in the area
Home Values in the Area
Average Home Value in this Area
Purchase History
| Date | Buyer | Sale Price | Title Company |
|---|---|---|---|
| Oxley Tony G | $76,500 | None Available | |
| 04 Contractors Inc | -- | None Available | |
| Oxley Jessie | $4,000 | -- | |
| Wade Alene | $15,000 | -- |
Source: Public Records
Mortgage History
| Date | Status | Borrower | Loan Amount |
|---|---|---|---|
| Open | Oxley Tony G | $77,811 | |
| Previous Owner | 04 Contractors Inc | $73,763 |
Source: Public Records
Tax History Compared to Growth
Tax History
| Year | Tax Paid | Tax Assessment Tax Assessment Total Assessment is a certain percentage of the fair market value that is determined by local assessors to be the total taxable value of land and additions on the property. | Land | Improvement |
|---|---|---|---|---|
| 2025 | $94 | $1,984 | $803 | $1,181 |
| 2024 | $94 | $1,926 | $660 | $1,266 |
| 2023 | $89 | $10,177 | $660 | $9,517 |
| 2022 | $800 | $9,881 | $660 | $9,221 |
| 2021 | $749 | $9,593 | $660 | $8,933 |
| 2020 | $723 | $9,314 | $660 | $8,654 |
| 2019 | $716 | $9,042 | $660 | $8,382 |
| 2018 | $701 | $8,779 | $660 | $8,119 |
| 2017 | $759 | $8,361 | $660 | $7,701 |
| 2016 | $784 | $8,415 | $440 | $7,975 |
| 2015 | $728 | $8,415 | $440 | $7,975 |
| 2014 | $743 | $8,415 | $440 | $7,975 |
Source: Public Records
Map
Nearby Homes
- 4 E Tahlequah Ave
- 1220 Division St
- 108 E Tahlequah Ave
- 0 0092-00-009-013-0-013-00 Unit 1187198
- 129 W Tahlequah Ave
- 128 W Tahlequah Ave
- 1603 E 2nd St
- 114 E Vinita Ave
- 1112 E 2nd St
- 0 June Dr
- 1200 E 4th St
- 401 E Tahlequah Ave
- 0 Eagle Unit 2530641
- 1 Eagle
- 0 Eagle Unit 2530643
- 1107 E 4th St
- 1601 E 4th St
- 0 W Broadway St
- 600 E Oklahoma Ave
- 719 E Wynnewood Ave
- 7 E Tahlequah Ave
- 11 E Tahlequah Ave
- 1318 E 1st St
- 8 E Tahlequah Ave
- 10 E Tahlequah Ave
- 1304 E 1st St
- 1324 Division St
- 16 E Oklahoma Ave
- 18 E Oklahoma Ave
- 20 E Tahlequah Ave
- 1318 Division St
- 1312 Division St
- 1400 Division St
- 1302 E 1st St
- 1302 E 1st St
- 1302 E 1st St
- 1302 Division St
- 11 E Tulsa Ave
- 11 E Tulsa Ave
- 1319 E 1st St