Estimated Value: $537,000 - $1,026,416
4
Beds
4
Baths
3,334
Sq Ft
$234/Sq Ft
Est. Value
About This Home
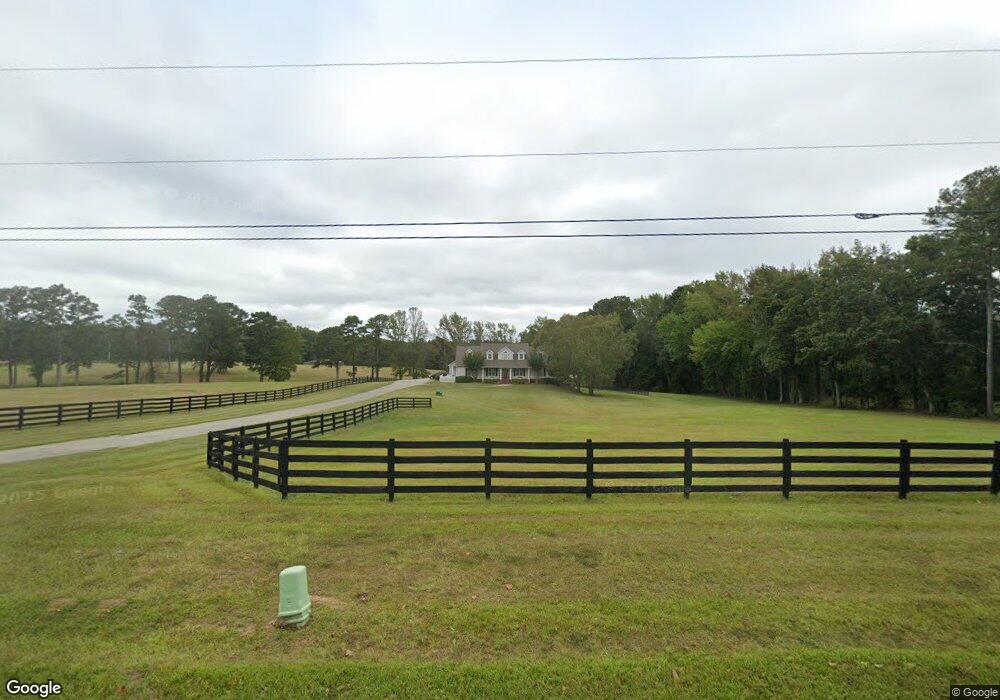
This home is located at 1321 Five Points Rd, Waco, GA 30182 and is currently estimated at $781,708, approximately $234 per square foot. 1321 Five Points Rd is a home located in Carroll County with nearby schools including Mt. Zion Elementary School, Mt. Zion Middle School, and Mt. Zion High School.
Ownership History
Date
Name
Owned For
Owner Type
Purchase Details
Closed on
Dec 30, 2005
Sold by
Crider Rickey T and Crider Cynthia C
Bought by
Rambo Todd A and Rambo Debra F
Current Estimated Value
Home Financials for this Owner
Home Financials are based on the most recent Mortgage that was taken out on this home.
Original Mortgage
$656,000
Outstanding Balance
$360,360
Interest Rate
6.18%
Mortgage Type
New Conventional
Estimated Equity
$421,348
Purchase Details
Closed on
Aug 24, 2004
Sold by
Crider Rickey T and Crider Cynthia C
Bought by
Crider Rickey T and Crider Cynthia C
Purchase Details
Closed on
Jul 15, 2003
Sold by
Dever Charles L
Bought by
Crider Rickey T and Crider Cynthia C
Purchase Details
Closed on
Mar 4, 1997
Sold by
Hembree John J and Hembree Elb
Bought by
Dever Charles L
Purchase Details
Closed on
Apr 3, 1996
Sold by
Eaves
Bought by
Hembree John J and Hembree Elb
Purchase Details
Closed on
Jun 22, 1991
Bought by
Eaves
Create a Home Valuation Report for This Property
The Home Valuation Report is an in-depth analysis detailing your home's value as well as a comparison with similar homes in the area
Home Values in the Area
Average Home Value in this Area
Purchase History
| Date | Buyer | Sale Price | Title Company |
|---|---|---|---|
| Rambo Todd A | $820,000 | -- | |
| Crider Rickey T | -- | -- | |
| Crider Rickey T | $240,000 | -- | |
| Dever Charles L | $128,200 | -- | |
| Hembree John J | $68,300 | -- | |
| Eaves | -- | -- |
Source: Public Records
Mortgage History
| Date | Status | Borrower | Loan Amount |
|---|---|---|---|
| Open | Rambo Todd A | $656,000 |
Source: Public Records
Tax History
| Year | Tax Paid | Tax Assessment Tax Assessment Total Assessment is a certain percentage of the fair market value that is determined by local assessors to be the total taxable value of land and additions on the property. | Land | Improvement |
|---|---|---|---|---|
| 2025 | $1,093 | $453,081 | $87,842 | $365,239 |
| 2024 | $1,103 | $453,081 | $87,842 | $365,239 |
| 2023 | $1,103 | $409,707 | $70,273 | $339,434 |
| 2022 | $6,557 | $319,659 | $46,848 | $272,811 |
| 2021 | $6,178 | $277,990 | $37,479 | $240,511 |
| 2020 | $5,722 | $249,683 | $34,072 | $215,611 |
| 2019 | $5,454 | $237,806 | $34,072 | $203,734 |
| 2018 | $5,174 | $224,328 | $34,072 | $190,256 |
| 2017 | $5,184 | $224,328 | $34,072 | $190,256 |
| 2016 | $5,179 | $224,328 | $34,072 | $190,256 |
| 2015 | $4,075 | $220,996 | $80,004 | $140,993 |
| 2014 | $4,085 | $220,997 | $80,004 | $140,993 |
Source: Public Records
Map
Nearby Homes
- 1605 5 Points Rd
- 231 Buncombe-Waco Rd Unit 44
- 231 Buncombe-Waco Rd
- 0 Mt Zion Rd Unit 7725838
- 0 Mt Zion Rd Unit 10699239
- 381 King St
- 409 Lively Rd
- 415 Lively Rd
- 419 Lively Rd
- 469 Lee Williams Rd
- 1001 Vong St
- 67 Depot St
- 610 Old Pleasant Hill Rd
- 405 Adler Point
- 142 Tyler Ln
- 0 Budapest Rd Unit 26199685
- 0 Budapest Rd Unit 10683829
- 0 Budapest Rd Unit 1522426
- 6058 Mount Zion Rd
- 898 Bowdon Junction Rd
- 1349 Five Points Rd
- 1349 Five Points Rd
- 1385 Five Points Rd
- 1385 Five Points Rd
- 1207 Five Points Rd
- 1175 Five Points Rd
- 1190 Five Points Rd
- 1143 Five Points Rd
- 300 J C Wright Rd
- 1467 Five Points Rd
- 1065 Five Points Rd
- 1540 Five Points Rd
- 0 Five Points Rd Unit 8370303
- 0 NW Five Points Rd Unit 8282649
- 0 Five Points Rd Unit 8280295
- 0 Five Points Rd Rd Unit 5927000
- 0 Five Points Rd Unit 8256557
- 0 Five Points Rd Unit 3143610
- 0 Five Points Rd Unit 7128168
- 0 Five Points Rd Unit 7426372
Your Personal Tour Guide
Ask me questions while you tour the home.