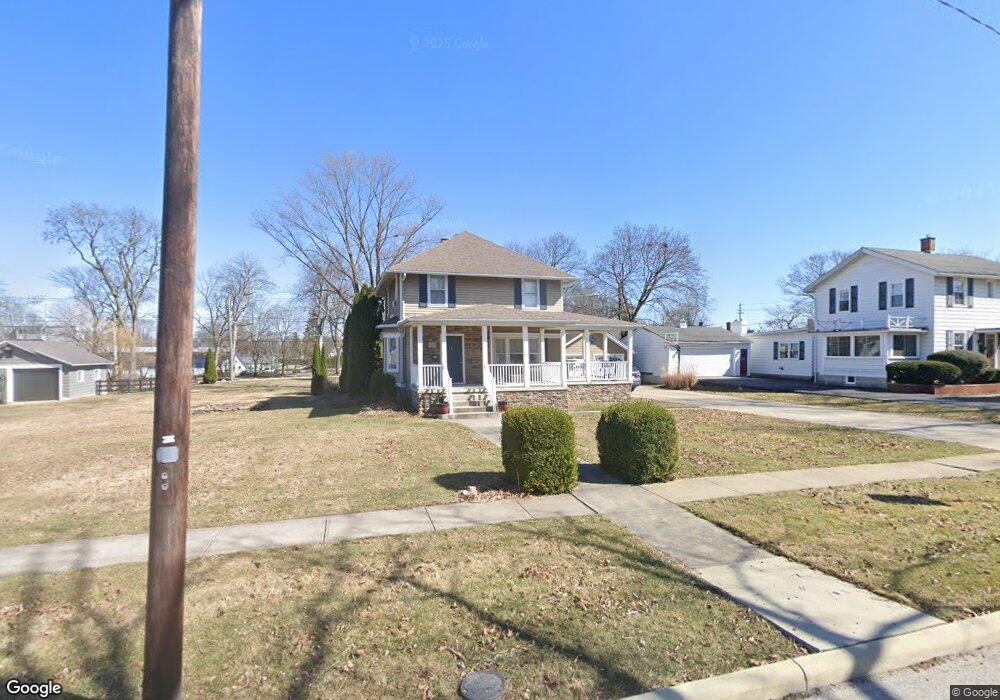
1321 Hurd Ave Findlay, OH 45840
Estimated Value: $205,000 - $298,000
3
Beds
2
Baths
1,518
Sq Ft
$165/Sq Ft
Est. Value
About This Home
This home is located at 1321 Hurd Ave, Findlay, OH 45840 and is currently estimated at $249,863, approximately $164 per square foot. 1321 Hurd Ave is a home located in Hancock County with nearby schools including Jefferson Elementary School, Chamberlin Hill Elementary School, and Donnell Middle School.
Ownership History
Date
Name
Owned For
Owner Type
Purchase Details
Closed on
Oct 15, 2010
Sold by
Cook Robert W and Cook Kathryn
Bought by
Johannigman Mark J
Current Estimated Value
Home Financials for this Owner
Home Financials are based on the most recent Mortgage that was taken out on this home.
Original Mortgage
$102,500
Outstanding Balance
$67,329
Interest Rate
4.26%
Mortgage Type
Purchase Money Mortgage
Estimated Equity
$182,534
Purchase Details
Closed on
Aug 4, 2003
Sold by
Cramer Joe R and Cramer Jennie B
Bought by
Cook Robert W and Cook Kathryn
Home Financials for this Owner
Home Financials are based on the most recent Mortgage that was taken out on this home.
Original Mortgage
$110,000
Interest Rate
5.31%
Mortgage Type
Purchase Money Mortgage
Create a Home Valuation Report for This Property
The Home Valuation Report is an in-depth analysis detailing your home's value as well as a comparison with similar homes in the area
Home Values in the Area
Average Home Value in this Area
Purchase History
| Date | Buyer | Sale Price | Title Company |
|---|---|---|---|
| Johannigman Mark J | $142,500 | Whitman Title Security | |
| Cook Robert W | -- | Abstract Title |
Source: Public Records
Mortgage History
| Date | Status | Borrower | Loan Amount |
|---|---|---|---|
| Open | Johannigman Mark J | $102,500 | |
| Previous Owner | Cook Robert W | $110,000 |
Source: Public Records
Tax History Compared to Growth
Tax History
| Year | Tax Paid | Tax Assessment Tax Assessment Total Assessment is a certain percentage of the fair market value that is determined by local assessors to be the total taxable value of land and additions on the property. | Land | Improvement |
|---|---|---|---|---|
| 2024 | $3,098 | $87,200 | $16,140 | $71,060 |
| 2023 | $3,103 | $87,200 | $16,140 | $71,060 |
| 2022 | $3,092 | $87,200 | $16,140 | $71,060 |
| 2021 | $3,046 | $74,830 | $16,530 | $58,300 |
| 2020 | $3,046 | $74,830 | $16,530 | $58,300 |
| 2019 | $2,984 | $74,830 | $16,530 | $58,300 |
| 2018 | $2,757 | $63,380 | $11,640 | $51,740 |
| 2017 | $1,378 | $63,380 | $11,640 | $51,740 |
| 2016 | $2,713 | $63,380 | $11,640 | $51,740 |
| 2015 | $2,080 | $47,550 | $11,640 | $35,910 |
| 2014 | $2,080 | $47,550 | $11,640 | $35,910 |
| 2012 | $2,114 | $47,960 | $12,050 | $35,910 |
Source: Public Records
Map
Nearby Homes
- 1421 Hurd Ave
- 1115 Liberty St
- 416 1/2 Lima Ave
- 412 Lima Ave
- 123 Glendale Ave
- 905 S West St
- 1621 S Main St
- 225 Lima Ave
- 1705 S Main St
- 211 Fairlawn Place
- 202 Hancock St
- 720 S West St
- 527 W Lincoln St
- 419 W Lincoln St
- 829 Maple Ave
- 420 1st St
- 1109 Park St
- 1727 Washington Ave
- 514 Liberty St
- 817 Park St