Estimated Value: $268,641 - $285,000
3
Beds
2
Baths
1,490
Sq Ft
$185/Sq Ft
Est. Value
About This Home
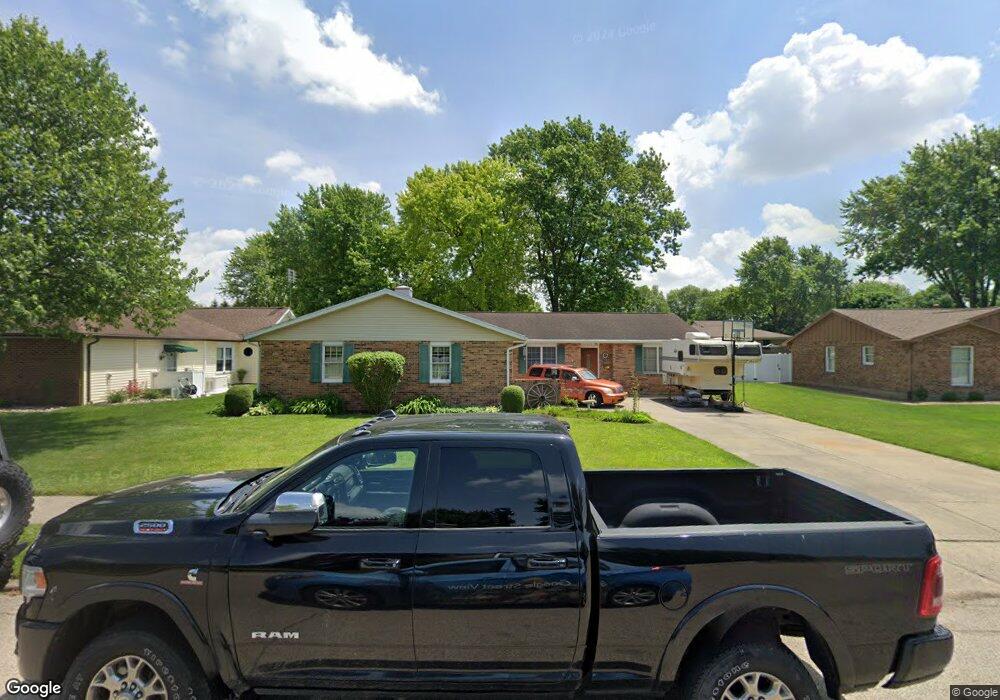
This home is located at 1321 Maplecrest Dr, Troy, OH 45373 and is currently estimated at $274,910, approximately $184 per square foot. 1321 Maplecrest Dr is a home located in Miami County with nearby schools including Forest Elementary School, Troy Junior High School, and Van Cleve Elementary School.
Ownership History
Date
Name
Owned For
Owner Type
Purchase Details
Closed on
Nov 22, 2015
Sold by
Shilling Evelyn M
Bought by
Shilling Teresa L and Clegg Teresa L
Current Estimated Value
Purchase Details
Closed on
Mar 6, 2015
Sold by
Clegg Scott H
Bought by
Shilling Teresa L
Home Financials for this Owner
Home Financials are based on the most recent Mortgage that was taken out on this home.
Original Mortgage
$108,500
Outstanding Balance
$82,977
Interest Rate
3.64%
Mortgage Type
New Conventional
Estimated Equity
$191,933
Purchase Details
Closed on
Feb 22, 2012
Sold by
Shilling Evelyn M
Bought by
Shilling Evelyn M and Clegg Scott H
Home Financials for this Owner
Home Financials are based on the most recent Mortgage that was taken out on this home.
Original Mortgage
$110,500
Interest Rate
3.38%
Mortgage Type
New Conventional
Purchase Details
Closed on
Oct 1, 1987
Bought by
Shilling James E
Create a Home Valuation Report for This Property
The Home Valuation Report is an in-depth analysis detailing your home's value as well as a comparison with similar homes in the area
Home Values in the Area
Average Home Value in this Area
Purchase History
| Date | Buyer | Sale Price | Title Company |
|---|---|---|---|
| Shilling Teresa L | -- | Attorney | |
| Shilling Teresa L | -- | Attorney | |
| Shilling Evelyn M | -- | Hallmark Title | |
| Shilling James E | $85,000 | -- |
Source: Public Records
Mortgage History
| Date | Status | Borrower | Loan Amount |
|---|---|---|---|
| Open | Shilling Teresa L | $108,500 | |
| Previous Owner | Shilling Evelyn M | $110,500 |
Source: Public Records
Tax History
| Year | Tax Paid | Tax Assessment Tax Assessment Total Assessment is a certain percentage of the fair market value that is determined by local assessors to be the total taxable value of land and additions on the property. | Land | Improvement |
|---|---|---|---|---|
| 2024 | $3,005 | $67,030 | $13,830 | $53,200 |
| 2023 | $2,527 | $67,030 | $13,830 | $53,200 |
| 2022 | $2,104 | $67,030 | $13,830 | $53,200 |
| 2021 | $1,704 | $51,560 | $10,640 | $40,920 |
| 2020 | $1,707 | $51,560 | $10,640 | $40,920 |
| 2019 | $1,722 | $51,560 | $10,640 | $40,920 |
| 2018 | $1,648 | $47,500 | $10,680 | $36,820 |
| 2017 | $1,665 | $47,500 | $10,680 | $36,820 |
| 2016 | $1,640 | $47,500 | $10,680 | $36,820 |
| 2015 | $1,269 | $43,960 | $9,870 | $34,090 |
| 2014 | $1,269 | $43,960 | $9,870 | $34,090 |
| 2013 | $1,277 | $43,960 | $9,870 | $34,090 |
Source: Public Records
Map
Nearby Homes
- 1210 Charleston Ct
- 1334 Skylark Dr
- 1117 Scenic Ct
- 1299 Stephenson Dr
- 1329 Lee Rd
- 1008 Plymouth Ct
- 1057 Stonyridge Ave
- 1133 Lee Rd
- 1075 Crestview Dr
- 1206 Heritage Dr
- 1257 Gettysburg Dr
- 1424 Michael Dr
- 1160 Waterloo St
- 1188 E Bentley Cir
- 1164 Waterloo St
- 1400 Troy Urbana Rd
- 1728 Hunters Ridge Dr
- 555 Miami St
- 1137 Auburn St
- 755 W Bentley Cir
- 1325 Maplecrest Dr
- 1317 Maplecrest Dr
- 1220 Northbrook Ln
- 1224 Northbrook Ln
- 1216 Northbrook Ln
- 1329 Maplecrest Dr
- 1313 Maplecrest Dr
- 1201 Charleston Ct
- 1228 Northbrook Ln
- 1212 Northbrook Ln
- 1324 Maplecrest Dr
- 1312 Maplecrest Dr
- 1333 Maplecrest Dr
- 1328 Maplecrest Dr
- 1309 Maplecrest Dr
- 1232 Northbrook Ln
- 1203 Charleston Ct
- 1221 Northbrook Ln
- 1332 Maplecrest Dr
- 1225 Northbrook Ln