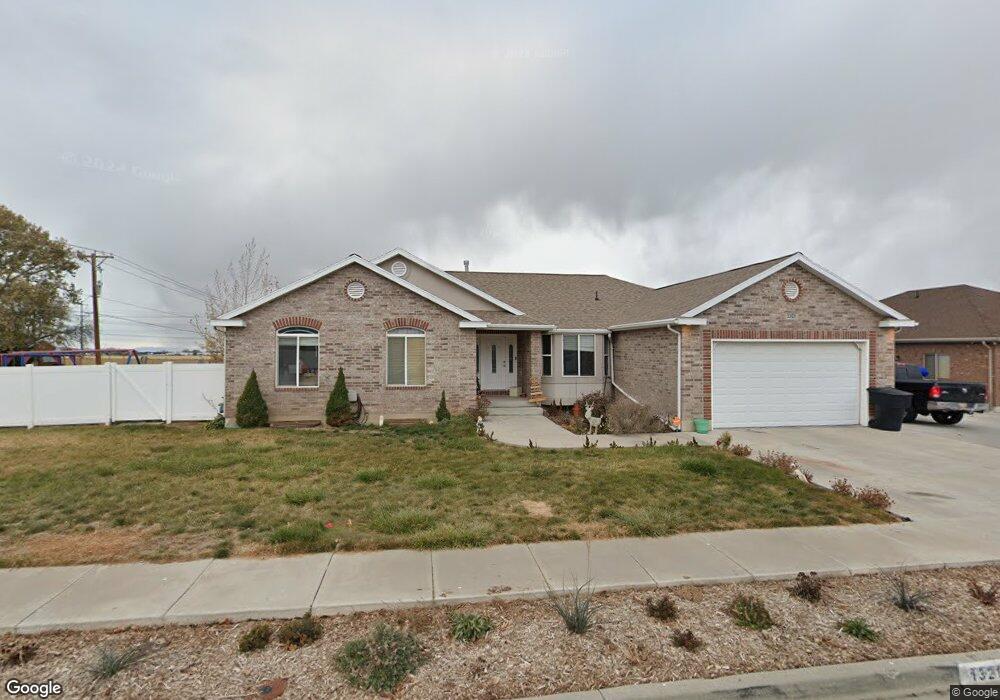
1321 N 1435 W Clearfield, UT 84015
Estimated Value: $670,000 - $687,026
7
Beds
4
Baths
4,348
Sq Ft
$156/Sq Ft
Est. Value
About This Home
This home is located at 1321 N 1435 W, Clearfield, UT 84015 and is currently estimated at $677,257, approximately $155 per square foot. 1321 N 1435 W is a home located in Davis County with nearby schools including Clinton Elementary School, Sunset Junior High School, and Clearfield High School.
Ownership History
Date
Name
Owned For
Owner Type
Purchase Details
Closed on
Oct 23, 2020
Sold by
Polley Jeffrey D
Bought by
Polley Jeffrey and Polley Erika
Current Estimated Value
Home Financials for this Owner
Home Financials are based on the most recent Mortgage that was taken out on this home.
Original Mortgage
$299,547
Outstanding Balance
$265,945
Interest Rate
2.8%
Mortgage Type
New Conventional
Estimated Equity
$411,312
Purchase Details
Closed on
Oct 30, 2006
Sold by
Johnson Thomas R
Bought by
Johnson Thomas R and Johnson Cindi B
Home Financials for this Owner
Home Financials are based on the most recent Mortgage that was taken out on this home.
Original Mortgage
$255,000
Interest Rate
6.36%
Mortgage Type
Stand Alone First
Purchase Details
Closed on
Mar 12, 2004
Sold by
Ken Mitchell Development Co
Bought by
Johnson Thomas R and Johnson Cindi B
Create a Home Valuation Report for This Property
The Home Valuation Report is an in-depth analysis detailing your home's value as well as a comparison with similar homes in the area
Home Values in the Area
Average Home Value in this Area
Purchase History
| Date | Buyer | Sale Price | Title Company |
|---|---|---|---|
| Polley Jeffrey | -- | Lincoln Title Insurance | |
| Johnson Thomas R | -- | Founders Title Co Layton | |
| Johnson Thomas R | -- | Founders Title Co Layton | |
| Johnson Thomas R | -- | Founders Title Company |
Source: Public Records
Mortgage History
| Date | Status | Borrower | Loan Amount |
|---|---|---|---|
| Open | Polley Jeffrey | $299,547 | |
| Previous Owner | Johnson Thomas R | $255,000 |
Source: Public Records
Tax History Compared to Growth
Tax History
| Year | Tax Paid | Tax Assessment Tax Assessment Total Assessment is a certain percentage of the fair market value that is determined by local assessors to be the total taxable value of land and additions on the property. | Land | Improvement |
|---|---|---|---|---|
| 2025 | -- | $345,950 | $104,000 | $241,950 |
| 2024 | -- | $349,800 | $112,281 | $237,519 |
| 2023 | $677 | $607,000 | $131,335 | $475,665 |
| 2022 | $677 | $350,900 | $76,011 | $274,889 |
| 2021 | $0 | $493,000 | $102,546 | $390,454 |
| 2020 | $2,954 | $429,000 | $91,292 | $337,708 |
| 2019 | $2,840 | $403,000 | $99,078 | $303,922 |
| 2018 | $2,647 | $369,000 | $82,735 | $286,265 |
| 2016 | $2,187 | $157,465 | $33,046 | $124,419 |
| 2015 | $2,089 | $143,000 | $33,046 | $109,954 |
| 2014 | $2,162 | $150,314 | $33,046 | $117,268 |
| 2013 | -- | $166,402 | $29,135 | $137,267 |
Source: Public Records
Map
Nearby Homes