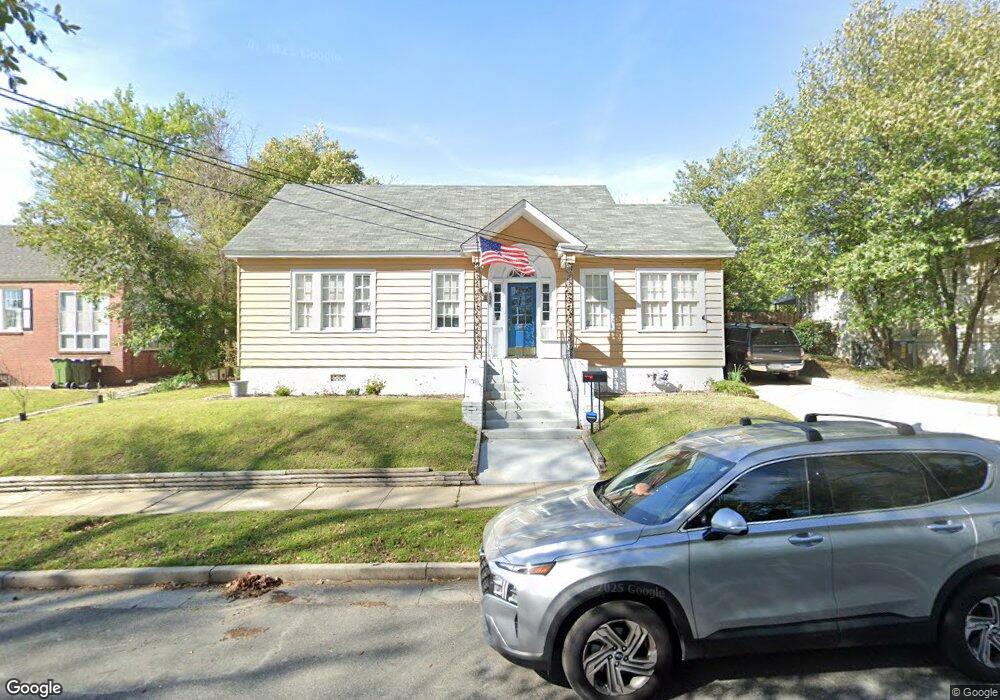
1321 Virginia St Columbus, GA 31901
Saint Elmo Weracoba NeighborhoodEstimated Value: $117,000 - $211,000
3
Beds
2
Baths
1,220
Sq Ft
$124/Sq Ft
Est. Value
About This Home
This home is located at 1321 Virginia St, Columbus, GA 31901 and is currently estimated at $151,260, approximately $123 per square foot. 1321 Virginia St is a home located in Muscogee County with nearby schools including Richards Middle School, Jordan Vocational High School, and Wynnton Elementary School.
Ownership History
Date
Name
Owned For
Owner Type
Purchase Details
Closed on
Oct 12, 2017
Sold by
Dyer Patricia Mae
Bought by
Hanna Joshua C and Hanna Natalie M
Current Estimated Value
Home Financials for this Owner
Home Financials are based on the most recent Mortgage that was taken out on this home.
Original Mortgage
$114,408
Outstanding Balance
$95,460
Interest Rate
3.78%
Mortgage Type
VA
Estimated Equity
$55,800
Purchase Details
Closed on
Mar 19, 2012
Sold by
Jones Ronald M
Bought by
Dyer Patricia Mae
Home Financials for this Owner
Home Financials are based on the most recent Mortgage that was taken out on this home.
Original Mortgage
$96,977
Interest Rate
3.87%
Mortgage Type
FHA
Purchase Details
Closed on
Oct 31, 2011
Sold by
Sec Of Housing & U
Bought by
Jones Ronald M
Purchase Details
Closed on
Sep 7, 2010
Sold by
Chase Home Finance Llc
Bought by
Sec Of Housing & Urban
Create a Home Valuation Report for This Property
The Home Valuation Report is an in-depth analysis detailing your home's value as well as a comparison with similar homes in the area
Home Values in the Area
Average Home Value in this Area
Purchase History
| Date | Buyer | Sale Price | Title Company |
|---|---|---|---|
| Hanna Joshua C | $112,000 | -- | |
| Dyer Patricia Mae | $99,500 | -- | |
| Jones Ronald M | $31,300 | -- | |
| Sec Of Housing & Urban | $126,630 | -- | |
| Chase Home Finance Llc | $126,630 | None Available |
Source: Public Records
Mortgage History
| Date | Status | Borrower | Loan Amount |
|---|---|---|---|
| Open | Hanna Joshua C | $114,408 | |
| Previous Owner | Dyer Patricia Mae | $96,977 |
Source: Public Records
Tax History
| Year | Tax Paid | Tax Assessment Tax Assessment Total Assessment is a certain percentage of the fair market value that is determined by local assessors to be the total taxable value of land and additions on the property. | Land | Improvement |
|---|---|---|---|---|
| 2025 | -- | $48,616 | $9,828 | $38,788 |
| 2024 | $1,903 | $48,616 | $9,828 | $38,788 |
| 2023 | $1,915 | $48,616 | $9,828 | $38,788 |
| 2022 | $1,560 | $38,204 | $9,828 | $28,376 |
| 2021 | $1,628 | $39,872 | $9,828 | $30,044 |
| 2020 | $1,628 | $39,872 | $9,828 | $30,044 |
| 2019 | $1,634 | $39,872 | $9,828 | $30,044 |
| 2018 | $1,634 | $39,872 | $9,828 | $30,044 |
| 2017 | $1,089 | $39,872 | $9,828 | $30,044 |
| 2016 | $1,094 | $39,800 | $6,760 | $33,040 |
| 2015 | $1,096 | $39,800 | $6,760 | $33,040 |
| 2014 | $1,098 | $39,800 | $6,760 | $33,040 |
| 2013 | -- | $39,800 | $6,760 | $33,040 |
Source: Public Records
Map
Nearby Homes
- 1317 Virginia St
- 1325 Virginia St
- 1316 15th St
- 1314 15th St
- 1326 15th St
- 1313 Virginia St
- 1335 Virginia St
- 1308 15th St
- 1332 15th St
- 1334 Virginia St
- 1310 Virginia St
- 1304 15th St
- 1337 Virginia St
- 1336 15th St
- 15th 15th St Unit 1031-1033
- 15th 15th St
- 1338 Virginia St
- 1319 15th St
- 1315 15th St
- 1418 13th Ave
Your Personal Tour Guide
Ask me questions while you tour the home.