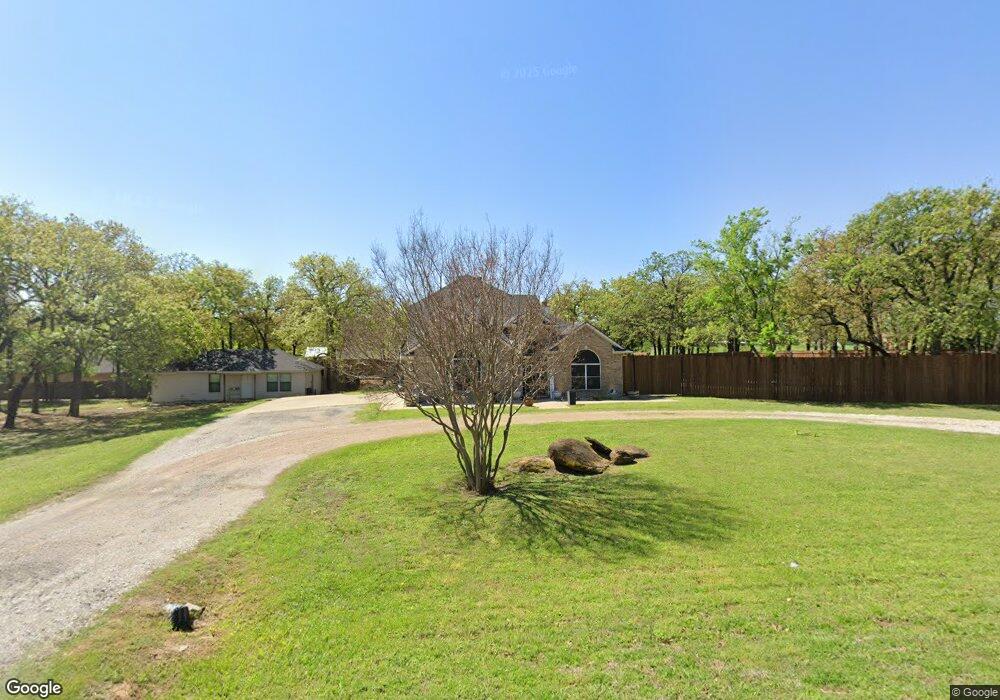
1321 W Buffalo Trail Joshua, TX 76058
Estimated Value: $504,000 - $553,000
5
Beds
4
Baths
2,703
Sq Ft
$198/Sq Ft
Est. Value
About This Home
This home is located at 1321 W Buffalo Trail, Joshua, TX 76058 and is currently estimated at $535,567, approximately $198 per square foot. 1321 W Buffalo Trail is a home located in Johnson County with nearby schools including H.D. Staples Elementary School, R C Loflin Middle School, and Joshua High School - 9th Grade Campus.
Ownership History
Date
Name
Owned For
Owner Type
Purchase Details
Closed on
Feb 11, 2020
Sold by
Holcomb Nicholaus R and Holcomb Hope
Bought by
Watson Casey Joe
Current Estimated Value
Home Financials for this Owner
Home Financials are based on the most recent Mortgage that was taken out on this home.
Original Mortgage
$307,920
Outstanding Balance
$273,261
Interest Rate
3.72%
Mortgage Type
New Conventional
Estimated Equity
$262,306
Purchase Details
Closed on
Sep 5, 2017
Sold by
Holliday Christopher and Holliday Angela
Bought by
Holcomb Nicholas R
Home Financials for this Owner
Home Financials are based on the most recent Mortgage that was taken out on this home.
Original Mortgage
$350,374
Interest Rate
3.92%
Mortgage Type
VA
Purchase Details
Closed on
Jan 20, 2016
Sold by
Everett Charles R and Everett Leta A
Bought by
Holliday Christopher and Holliday Angela
Create a Home Valuation Report for This Property
The Home Valuation Report is an in-depth analysis detailing your home's value as well as a comparison with similar homes in the area
Home Values in the Area
Average Home Value in this Area
Purchase History
| Date | Buyer | Sale Price | Title Company |
|---|---|---|---|
| Watson Casey Joe | -- | Providence Title Company | |
| Holcomb Nicholas R | -- | None Available | |
| Holliday Christopher | -- | None Available |
Source: Public Records
Mortgage History
| Date | Status | Borrower | Loan Amount |
|---|---|---|---|
| Open | Watson Casey Joe | $307,920 | |
| Previous Owner | Holcomb Nicholas R | $350,374 |
Source: Public Records
Tax History Compared to Growth
Tax History
| Year | Tax Paid | Tax Assessment Tax Assessment Total Assessment is a certain percentage of the fair market value that is determined by local assessors to be the total taxable value of land and additions on the property. | Land | Improvement |
|---|---|---|---|---|
| 2025 | $8,928 | $443,093 | $106,250 | $336,843 |
| 2024 | $10,574 | $434,465 | $0 | $0 |
| 2023 | $7,394 | $394,968 | $58,125 | $336,843 |
| 2022 | $9,910 | $394,968 | $58,125 | $336,843 |
| 2021 | $9,998 | $394,968 | $58,125 | $336,843 |
| 2020 | $10,172 | $371,552 | $58,125 | $313,427 |
| 2019 | $9,703 | $337,272 | $40,000 | $297,272 |
| 2018 | $9,972 | $337,272 | $40,000 | $297,272 |
| 2017 | $7,078 | $239,528 | $40,000 | $199,528 |
| 2016 | $7,078 | $239,528 | $40,000 | $199,528 |
| 2015 | $5,973 | $239,528 | $40,000 | $199,528 |
| 2014 | $5,973 | $230,153 | $30,625 | $199,528 |
Source: Public Records
Map
Nearby Homes
- 6490 County Road 1022
- 5529 County Road 1022
- 1700 Don Lee Rd
- 2027 Don Lee Rd
- 1945 Chisholm Trail Pkwy
- 1000 County Road 904
- 1728 County Road 904
- 5040 Wagon Wheel Rd
- 2117 Jordan Ct
- 1509 Saguaro Trail
- 1501 Saguaro Trail
- 1516 Saguaro Trail
- 1481 Saguaro Trail
- Retreat Plan at Cactus Ridge
- Canyon Plan at Cactus Ridge
- Stockyard Plan at Cactus Ridge
- 4708 Coyote Ct
- 1473 Saguaro Trail
- 1458 Saguaro Trail
- 1440 Saguaro Trail
- 5632 County Road 1022
- 1320 W Buffalo Trail
- 1309 W Buffalo Trail
- 5628 County Road 1022
- 1316 W Buffalo Trail
- 5728 County Road 1022
- 5637 County Road 1022
- 5713 County Road 1022
- 5641 County Road 1022
- 1301 W Buffalo Trail
- 5721 County Road 1022
- 5612 County Road 1022
- 1316 County Road 905a
- 5729 County Road 1022
- 1223 W Buffalo Trail
- 1300 W Buffalo Trail
- 5740 County Road 1022
- 1308 County Road 905a
- 5629 County Road 1022
- 5741 County Road 1022