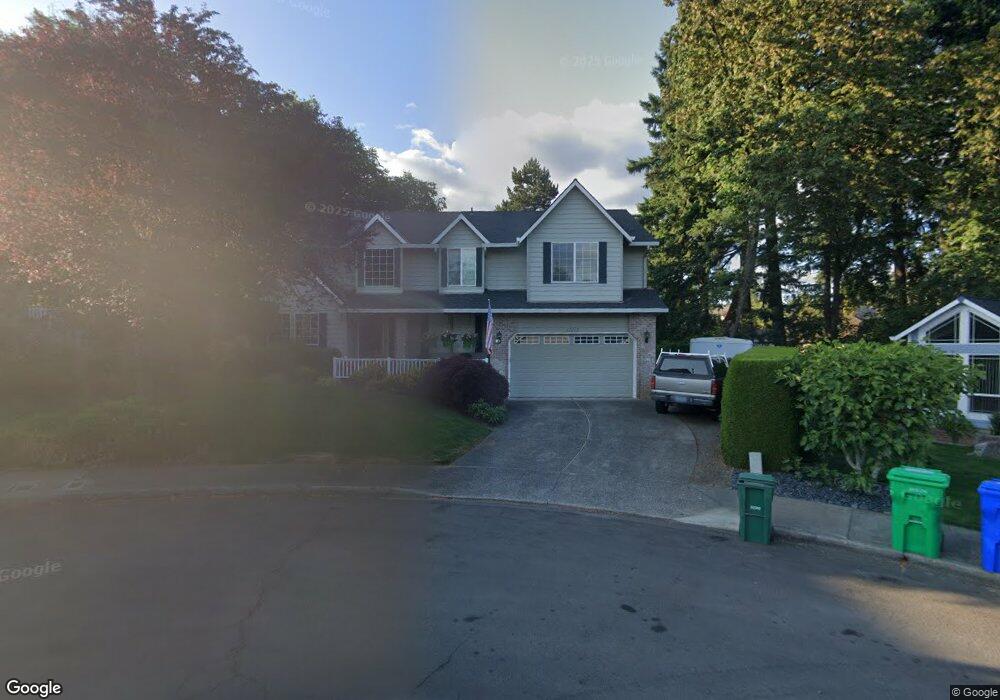
13213 SE Comanche Ct Clackamas, OR 97015
Estimated Value: $664,274 - $723,000
4
Beds
3
Baths
2,346
Sq Ft
$296/Sq Ft
Est. Value
About This Home
This home is located at 13213 SE Comanche Ct, Clackamas, OR 97015 and is currently estimated at $693,319, approximately $295 per square foot. 13213 SE Comanche Ct is a home located in Clackamas County with nearby schools including Oregon Trail Elementary School, Rock Creek Middle School, and Clackamas High School.
Ownership History
Date
Name
Owned For
Owner Type
Purchase Details
Closed on
May 31, 2012
Sold by
Christensen Karl G and Christensen Debra A
Bought by
Christensen Karl G and Christensen Debra A
Current Estimated Value
Purchase Details
Closed on
Aug 8, 1998
Sold by
Dittman Harry P and Dittman Betty L
Bought by
Christensen Karl G and Christensen Debra A
Home Financials for this Owner
Home Financials are based on the most recent Mortgage that was taken out on this home.
Original Mortgage
$150,000
Outstanding Balance
$30,457
Interest Rate
6.91%
Estimated Equity
$662,862
Purchase Details
Closed on
Jul 15, 1996
Sold by
Kelly W Dennis and Johanna Kelly N
Bought by
Dittman Harry P and Dittman Betty L
Purchase Details
Closed on
Jun 22, 1995
Sold by
Hamill Robert A and Hamill Jeannine M
Bought by
Kelly Dennis and Kelly Johanna
Create a Home Valuation Report for This Property
The Home Valuation Report is an in-depth analysis detailing your home's value as well as a comparison with similar homes in the area
Home Values in the Area
Average Home Value in this Area
Purchase History
| Date | Buyer | Sale Price | Title Company |
|---|---|---|---|
| Christensen Karl G | -- | None Available | |
| Christensen Karl G | $207,000 | First American Title Ins Co | |
| Dittman Harry P | $188,500 | Chicago Title Insurance Co | |
| Kelly Dennis | $179,500 | Chicago Title Insurance Co |
Source: Public Records
Mortgage History
| Date | Status | Borrower | Loan Amount |
|---|---|---|---|
| Open | Christensen Karl G | $150,000 |
Source: Public Records
Tax History Compared to Growth
Tax History
| Year | Tax Paid | Tax Assessment Tax Assessment Total Assessment is a certain percentage of the fair market value that is determined by local assessors to be the total taxable value of land and additions on the property. | Land | Improvement |
|---|---|---|---|---|
| 2025 | $7,794 | $409,971 | -- | -- |
| 2024 | $7,519 | $398,031 | -- | -- |
| 2023 | $7,519 | $386,438 | $0 | $0 |
| 2022 | $6,915 | $375,183 | $0 | $0 |
| 2021 | $6,624 | $364,256 | $0 | $0 |
| 2020 | $6,225 | $353,647 | $0 | $0 |
| 2019 | $6,162 | $343,347 | $0 | $0 |
| 2018 | $5,568 | $333,347 | $0 | $0 |
| 2017 | $5,390 | $323,638 | $0 | $0 |
| 2016 | $5,198 | $314,212 | $0 | $0 |
| 2015 | $5,198 | $305,060 | $0 | $0 |
| 2014 | $4,681 | $294,445 | $0 | $0 |
Source: Public Records
Map
Nearby Homes
- 14734 SE 131st Dr
- 14646 SE Megan Way
- 14880 SE Marci Way
- 14198 SE Iseli Ln
- 14196 SE Iseli Ln
- 17303 SE 130th Ave
- 14192 SE Iseli Ln
- 14194 SE Iseli Ln
- 14890 SE Lostine Dr
- 12064 SE Grand Vista Dr
- 13900 SE Highway 212
- 13900 SE Highway 212 Unit 62
- 13900 SE Highway 212 Unit 125
- 13900 SE Highway 212 Unit 181
- 13900 SE Highway 212 Unit 190
- 13900 SE Highway 212 Unit 16
- 13900 SE Highway 212 Unit 185
- 13640 SE Highway 212 Unit 39
- 13640 SE Highway 212 Unit 121
- 13640 SE Highway 212 Unit 46
- 13207 SE Comanche Ct
- 13221 SE Comanche Ct
- 13224 SE Comanche Ct
- 14912 SE 131st Dr
- 14848 SE 131st Dr
- 14785 SE 132nd Ave
- 13210 SE Comanche Ct
- 14759 SE 132nd Ave
- 14814 SE 131st Dr
- 13218 SE Comanche Ct
- 14819 SE 132nd Ave
- 14940 SE 131st Dr
- 14741 SE 132nd Ave
- 14796 SE 131st Dr
- 14946 SE 131st Dr
- 14897 SE 131st Dr
- 14727 SE 132nd Ave
- 14867 SE 131st Dr
- 14782 SE 131st Dr
- 14915 SE 131st Dr