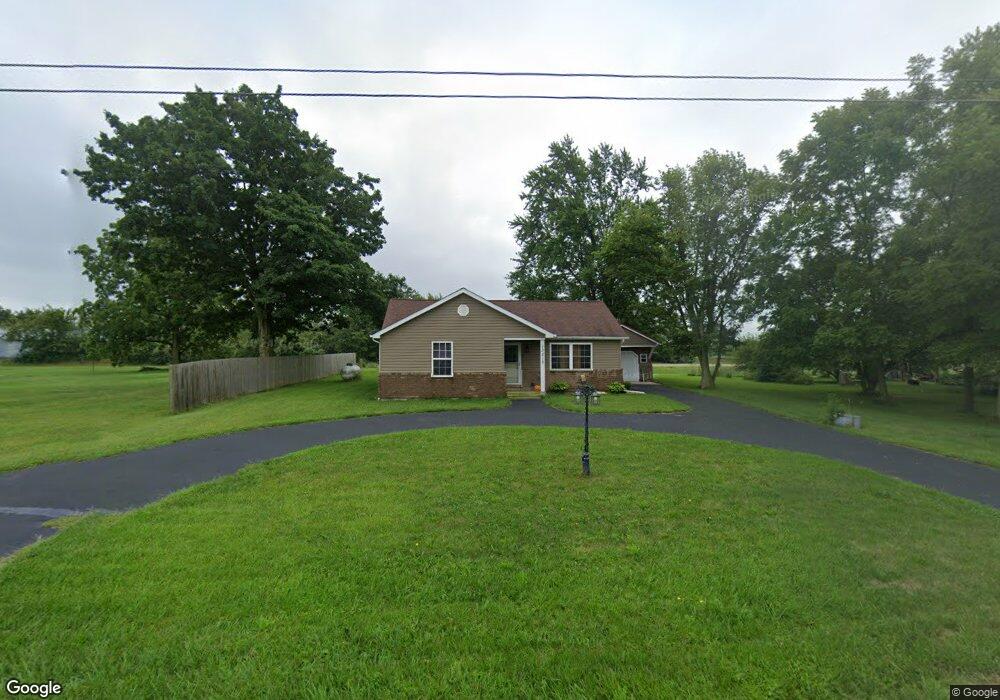
13219 E National Rd South Vienna, OH 45369
Estimated Value: $234,890 - $264,000
2
Beds
2
Baths
1,132
Sq Ft
$217/Sq Ft
Est. Value
About This Home
This home is located at 13219 E National Rd, South Vienna, OH 45369 and is currently estimated at $245,723, approximately $217 per square foot. 13219 E National Rd is a home located in Clark County with nearby schools including Northeastern Elementary School and Northeastern Middle & High School.
Ownership History
Date
Name
Owned For
Owner Type
Purchase Details
Closed on
Dec 29, 2017
Sold by
Reeves Allen and Reeves Sue
Bought by
Weimer Kari A
Current Estimated Value
Home Financials for this Owner
Home Financials are based on the most recent Mortgage that was taken out on this home.
Original Mortgage
$122,310
Outstanding Balance
$103,109
Interest Rate
3.9%
Mortgage Type
New Conventional
Estimated Equity
$142,614
Purchase Details
Closed on
May 11, 2017
Sold by
Leffel Harryy R and Leffel Teresa J
Bought by
Reeves Allen and Reeves Sue
Purchase Details
Closed on
Oct 15, 2004
Sold by
Skinner Dorothy Mae and Skinner Dorothy M
Bought by
Washburn Mathew J and Washburn Sarah M
Home Financials for this Owner
Home Financials are based on the most recent Mortgage that was taken out on this home.
Original Mortgage
$74,000
Interest Rate
5.93%
Mortgage Type
Purchase Money Mortgage
Create a Home Valuation Report for This Property
The Home Valuation Report is an in-depth analysis detailing your home's value as well as a comparison with similar homes in the area
Home Values in the Area
Average Home Value in this Area
Purchase History
| Date | Buyer | Sale Price | Title Company |
|---|---|---|---|
| Weimer Kari A | $135,900 | Midland Title Wests | |
| Reeves Allen | $23,000 | None Available | |
| Washburn Mathew J | $74,000 | -- |
Source: Public Records
Mortgage History
| Date | Status | Borrower | Loan Amount |
|---|---|---|---|
| Open | Weimer Kari A | $122,310 | |
| Previous Owner | Washburn Mathew J | $74,000 |
Source: Public Records
Tax History Compared to Growth
Tax History
| Year | Tax Paid | Tax Assessment Tax Assessment Total Assessment is a certain percentage of the fair market value that is determined by local assessors to be the total taxable value of land and additions on the property. | Land | Improvement |
|---|---|---|---|---|
| 2024 | $2,160 | $51,930 | $7,140 | $44,790 |
| 2023 | $2,160 | $51,930 | $7,140 | $44,790 |
| 2022 | $2,168 | $51,930 | $7,140 | $44,790 |
| 2021 | $2,014 | $40,920 | $5,530 | $35,390 |
| 2020 | $2,016 | $40,920 | $5,530 | $35,390 |
| 2019 | $2,103 | $40,920 | $5,530 | $35,390 |
| 2018 | $1,793 | $33,730 | $4,980 | $28,750 |
| 2017 | $113 | $2,489 | $2,489 | $0 |
| 2016 | $113 | $2,489 | $2,489 | $0 |
| 2015 | $59 | $2,489 | $2,489 | $0 |
| 2014 | $117 | $2,489 | $2,489 | $0 |
| 2013 | $58 | $2,489 | $2,489 | $0 |
Source: Public Records
Map
Nearby Homes
- 13183 E National Rd
- 711 Wilson Rd
- 2321 N Houston
- 2367 N Houston Pike
- 935 Sylvan Shores Dr
- 1026 George Allen Dr
- 1196 George Allen Dr
- 108 Markley Rd
- 0 N Urbana Lisbon Rd
- 3211 Old Columbus Rd
- 12100 Collins Arbogast Rd
- 0 Vernon Asbury Rd Unit 11585913
- 1300 W Choctaw Dr
- 1340 W Choctaw Dr
- 1495 W Choctaw Dr
- 1405 Chickasaw Dr
- 13231 E National Rd
- 13245 E National Rd
- 13152 E National Rd
- 13259 E National Rd
- 13120 E National Rd
- 13293 E National Rd
- 13097 E National Rd
- 13088 E National Rd
- 13065 E National Rd
- 13086 E National Rd
- 13062 E National Rd
- 13053 E National Rd
- 13036 E National Rd
- 13037 E National Rd
- 13438 E National Rd
- 13040 North St
- 12978 E National Rd
- 84 S Houston Pike
- 70 S Houston Pike
- 13022 North St