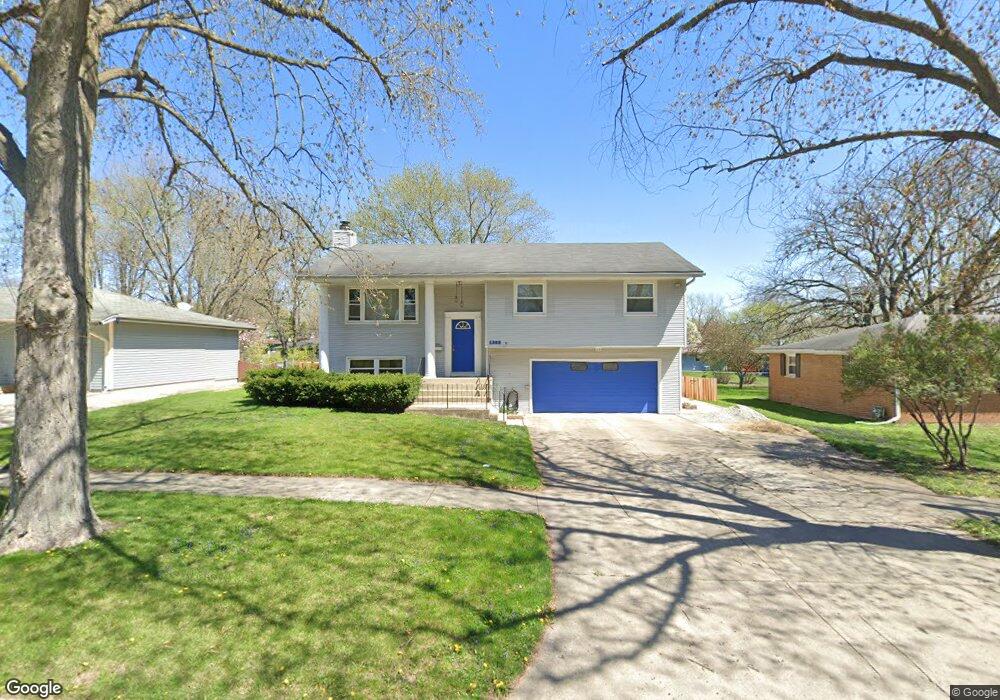
1322 Amber Dr Montgomery, IL 60538
Estimated Value: $278,045 - $318,000
3
Beds
2
Baths
1,722
Sq Ft
$176/Sq Ft
Est. Value
About This Home
This home is located at 1322 Amber Dr, Montgomery, IL 60538 and is currently estimated at $303,261, approximately $176 per square foot. 1322 Amber Dr is a home located in Kane County with nearby schools including Dieterich Elementary School, K D Waldo Middle School, and East Aurora High School.
Ownership History
Date
Name
Owned For
Owner Type
Purchase Details
Closed on
Jul 27, 2007
Sold by
Wolf Lawrence A
Bought by
Putz Matthew P and Putz Bartholomew T
Current Estimated Value
Home Financials for this Owner
Home Financials are based on the most recent Mortgage that was taken out on this home.
Original Mortgage
$193,799
Outstanding Balance
$123,017
Interest Rate
6.71%
Mortgage Type
New Conventional
Estimated Equity
$180,244
Purchase Details
Closed on
Aug 8, 2005
Sold by
Mendez Saul
Bought by
Wolf Lawrence A
Home Financials for this Owner
Home Financials are based on the most recent Mortgage that was taken out on this home.
Original Mortgage
$175,000
Interest Rate
5.5%
Mortgage Type
Purchase Money Mortgage
Purchase Details
Closed on
Jan 23, 2002
Sold by
Lindgren Melissa D and Green Melissa D
Bought by
Mendez Saul
Home Financials for this Owner
Home Financials are based on the most recent Mortgage that was taken out on this home.
Original Mortgage
$151,050
Interest Rate
7.14%
Create a Home Valuation Report for This Property
The Home Valuation Report is an in-depth analysis detailing your home's value as well as a comparison with similar homes in the area
Home Values in the Area
Average Home Value in this Area
Purchase History
| Date | Buyer | Sale Price | Title Company |
|---|---|---|---|
| Putz Matthew P | $204,000 | First American Title | |
| Wolf Lawrence A | $190,000 | Multiple | |
| Mendez Saul | $159,000 | -- |
Source: Public Records
Mortgage History
| Date | Status | Borrower | Loan Amount |
|---|---|---|---|
| Open | Putz Matthew P | $193,799 | |
| Previous Owner | Wolf Lawrence A | $175,000 | |
| Previous Owner | Mendez Saul | $151,050 |
Source: Public Records
Tax History Compared to Growth
Tax History
| Year | Tax Paid | Tax Assessment Tax Assessment Total Assessment is a certain percentage of the fair market value that is determined by local assessors to be the total taxable value of land and additions on the property. | Land | Improvement |
|---|---|---|---|---|
| 2024 | $3,482 | $62,639 | $9,992 | $52,647 |
| 2023 | $3,164 | $55,968 | $8,928 | $47,040 |
| 2022 | $3,563 | $59,253 | $8,146 | $51,107 |
| 2021 | $3,501 | $55,165 | $7,584 | $47,581 |
| 2020 | $3,319 | $51,240 | $7,044 | $44,196 |
| 2019 | $3,264 | $47,475 | $6,526 | $40,949 |
| 2018 | $3,213 | $44,980 | $6,036 | $38,944 |
| 2017 | $3,213 | $41,838 | $6,953 | $34,885 |
| 2016 | $3,037 | $37,256 | $5,960 | $31,296 |
| 2015 | -- | $32,808 | $5,694 | $27,114 |
| 2014 | -- | $30,267 | $5,233 | $25,034 |
| 2013 | -- | $32,253 | $5,518 | $26,735 |
Source: Public Records
Map
Nearby Homes
- 1321 Raymond Dr
- 1150 Gates St
- 982 Garnet Ln
- 986 Garnet Ln
- 974 Garnet Ln
- 994 Garnet Ln
- 970 Garnet Ln
- 978 Garnet Ln
- 966 Garnet Ln
- 1042 Emerald Dr
- 962 Garnet Ln
- BELLAMY Plan at Marquis Pointe
- SIENNA Plan at Marquis Pointe
- HOLCOMBE Plan at Marquis Pointe
- HENLEY Plan at Marquis Pointe
- 1038 Emerald Dr
- 1130 S Spencer St
- 995 Celebration Dr
- 1011 Celebration Dr
- 1015 Celebration Dr
- 1320 Amber Dr Unit 2
- 1324 Amber Dr
- 1321 Royal Dr
- 1318 Amber Dr
- 1326 Amber Dr
- 1319 Royal Dr Unit 3
- 1323 Royal Dr
- 1321 Amber Dr
- 1317 Royal Dr
- 1325 Royal Dr
- 1319 Amber Dr
- 1323 Amber Dr
- 1316 Amber Dr
- 1328 Amber Dr Unit 2
- 1317 Amber Dr Unit 2
- 1325 Amber Dr
- 1315 Royal Dr
- 1327 Royal Dr
- 1315 Amber Dr
- 1327 Amber Dr