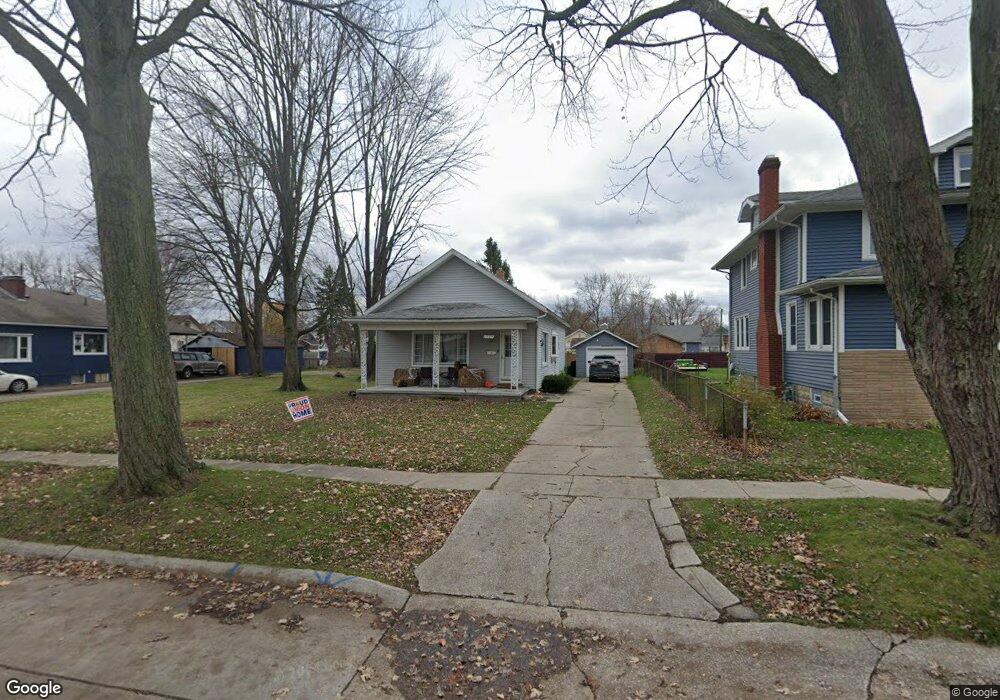
1322 Chestnut St Port Huron, MI 48060
Estimated Value: $104,000 - $117,000
2
Beds
1
Bath
1,035
Sq Ft
$107/Sq Ft
Est. Value
About This Home
This home is located at 1322 Chestnut St, Port Huron, MI 48060 and is currently estimated at $110,394, approximately $106 per square foot. 1322 Chestnut St is a home located in St. Clair County with nearby schools including Woodrow Wilson Elementary School, Central Middle School, and Port Huron High School.
Ownership History
Date
Name
Owned For
Owner Type
Purchase Details
Closed on
Jul 1, 2011
Sold by
Jones Peter A and Jones Erica M
Bought by
Asset Link Llc
Current Estimated Value
Purchase Details
Closed on
Jun 26, 2008
Sold by
Mccoll Edward D
Bought by
Wachovia Equity Servicing Llc
Create a Home Valuation Report for This Property
The Home Valuation Report is an in-depth analysis detailing your home's value as well as a comparison with similar homes in the area
Home Values in the Area
Average Home Value in this Area
Purchase History
| Date | Buyer | Sale Price | Title Company |
|---|---|---|---|
| Asset Link Llc | $11,500 | Liberty Title | |
| Asset Link Llc | $11,500 | Liberty Title | |
| Wachovia Equity Servicing Llc | $44,629 | None Available |
Source: Public Records
Tax History
| Year | Tax Paid | Tax Assessment Tax Assessment Total Assessment is a certain percentage of the fair market value that is determined by local assessors to be the total taxable value of land and additions on the property. | Land | Improvement |
|---|---|---|---|---|
| 2025 | $1,304 | $47,700 | $0 | $0 |
| 2024 | $1,268 | $45,200 | $0 | $0 |
| 2023 | $1,201 | $40,000 | $0 | $0 |
| 2022 | $1,156 | $31,300 | $0 | $0 |
| 2020 | $1,109 | $23,400 | $23,400 | $0 |
| 2019 | $1,089 | $17,500 | $0 | $0 |
| 2018 | $1,065 | $17,500 | $0 | $0 |
| 2017 | $978 | $16,900 | $0 | $0 |
| 2016 | $862 | $16,900 | $0 | $0 |
| 2015 | $845 | $16,500 | $16,500 | $0 |
| 2014 | $845 | $15,700 | $15,700 | $0 |
| 2013 | -- | $15,700 | $0 | $0 |
Source: Public Records
Map
Nearby Homes
Your Personal Tour Guide
Ask me questions while you tour the home.