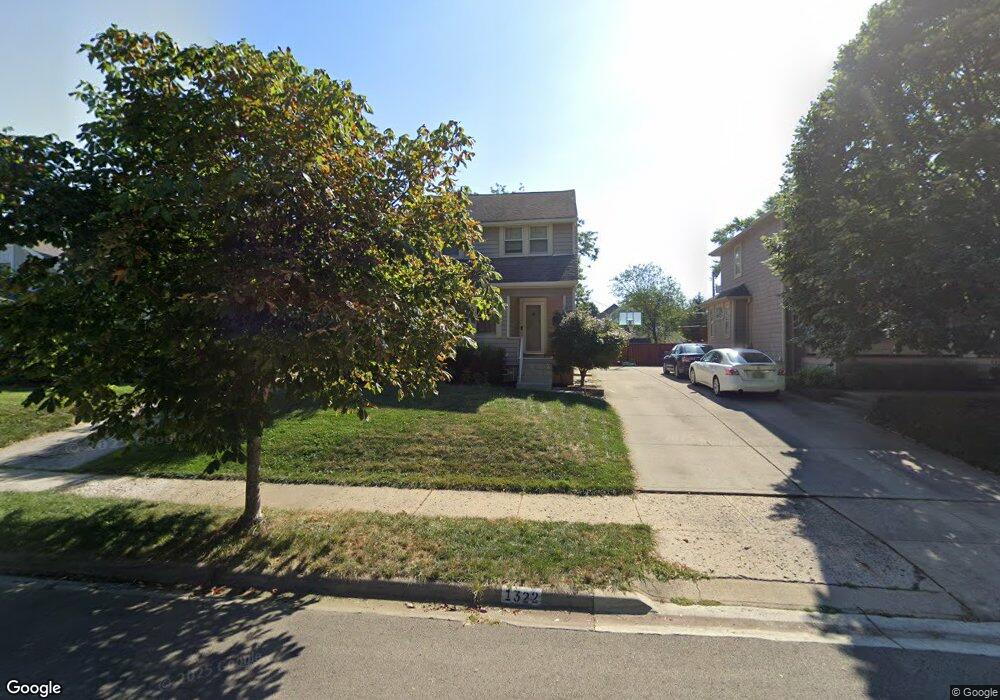
1322 Glenn Ave Columbus, OH 43212
Estimated Value: $556,588 - $899,000
3
Beds
2
Baths
1,400
Sq Ft
$482/Sq Ft
Est. Value
About This Home
This home is located at 1322 Glenn Ave, Columbus, OH 43212 and is currently estimated at $675,397, approximately $482 per square foot. 1322 Glenn Ave is a home located in Franklin County with nearby schools including Robert Louis Stevenson Elementary School, Larson Middle School, and Grandview Heights High School.
Ownership History
Date
Name
Owned For
Owner Type
Purchase Details
Closed on
Jul 1, 2025
Sold by
Gambone Betsy A
Bought by
Gambone Jason M
Current Estimated Value
Purchase Details
Closed on
Aug 5, 2011
Sold by
Huffner Michael J and Tran Terry D
Bought by
Gambone Jason M and Gambone Betsy A
Home Financials for this Owner
Home Financials are based on the most recent Mortgage that was taken out on this home.
Original Mortgage
$285,000
Interest Rate
4.58%
Mortgage Type
New Conventional
Purchase Details
Closed on
Jul 5, 2000
Sold by
Hennacy Charlotte J
Bought by
Tran Terry D and Huffner Michael J
Home Financials for this Owner
Home Financials are based on the most recent Mortgage that was taken out on this home.
Original Mortgage
$179,000
Interest Rate
8.64%
Mortgage Type
VA
Purchase Details
Closed on
Jul 22, 1970
Bought by
Hennacy Charlotte J
Create a Home Valuation Report for This Property
The Home Valuation Report is an in-depth analysis detailing your home's value as well as a comparison with similar homes in the area
Home Values in the Area
Average Home Value in this Area
Purchase History
| Date | Buyer | Sale Price | Title Company |
|---|---|---|---|
| Gambone Jason M | -- | None Listed On Document | |
| Gambone Jason M | $300,000 | Powell Tit | |
| Tran Terry D | $175,500 | Chicago Title | |
| Hennacy Charlotte J | -- | -- |
Source: Public Records
Mortgage History
| Date | Status | Borrower | Loan Amount |
|---|---|---|---|
| Previous Owner | Gambone Jason M | $285,000 | |
| Previous Owner | Tran Terry D | $179,000 |
Source: Public Records
Tax History
| Year | Tax Paid | Tax Assessment Tax Assessment Total Assessment is a certain percentage of the fair market value that is determined by local assessors to be the total taxable value of land and additions on the property. | Land | Improvement |
|---|---|---|---|---|
| 2025 | $9,758 | $167,300 | $92,610 | $74,690 |
| 2024 | $9,758 | $167,300 | $92,610 | $74,690 |
| 2023 | $8,548 | $167,300 | $92,610 | $74,690 |
| 2022 | $8,192 | $136,540 | $50,370 | $86,170 |
| 2021 | $7,670 | $136,540 | $50,370 | $86,170 |
| 2020 | $7,638 | $136,540 | $50,370 | $86,170 |
| 2019 | $7,323 | $115,860 | $50,370 | $65,490 |
| 2018 | $6,799 | $115,860 | $50,370 | $65,490 |
| 2017 | $6,828 | $115,860 | $50,370 | $65,490 |
| 2016 | $6,306 | $91,600 | $40,810 | $50,790 |
| 2015 | $6,306 | $91,600 | $40,810 | $50,790 |
| 2014 | $6,325 | $91,600 | $40,810 | $50,790 |
| 2013 | $2,779 | $83,265 | $37,100 | $46,165 |
Source: Public Records
Map
Nearby Homes
- 1230 Glenn Ave
- 1365 Elmwood Ave
- 1875 W 1st Ave
- 1263 Oakland Ave
- 1410 Arlington Ave
- 1523 Wyandotte Rd
- 1561 Glenn Ave
- 1427 Roxbury Rd Unit Manor House North
- 1606 Elmwood Ave
- 1000 Urlin Ave Unit 2007
- 1000 Urlin Ave Unit 1407
- 1000 Urlin Ave Unit 1007
- 1000 Urlin Ave Unit 1507
- 1000 Urlin Ave Unit 920
- 1000 Urlin Ave Unit 511
- 1000 Urlin Ave Unit 1402
- 1000 Urlin Ave Unit 1607
- 1000 Urlin Ave Unit 518
- 1500 Fairview Ave
- 1579 Arlington Ave Unit 1579B
- 1326 Glenn Ave
- 1316 Glenn Ave
- 1334 Glenn Ave
- 1304 Glenn Ave
- 1340 Glenn Ave
- 1300 Glenn Ave
- 1346 Glenn Ave
- 1305 Westwood Ave
- 1298 Glenn Ave
- 1317 Westwood Ave
- 1323 Westwood Ave
- 1299 Westwood Ave
- 1317 Glenn Ave
- 1327 Glenn Ave
- 1352 Glenn Ave
- 1294 Glenn Ave
- 1321 Westwood Ave
- 1303 Glenn Ave
- 1333 Glenn Ave
- 1295 Westwood Ave
Your Personal Tour Guide
Ask me questions while you tour the home.