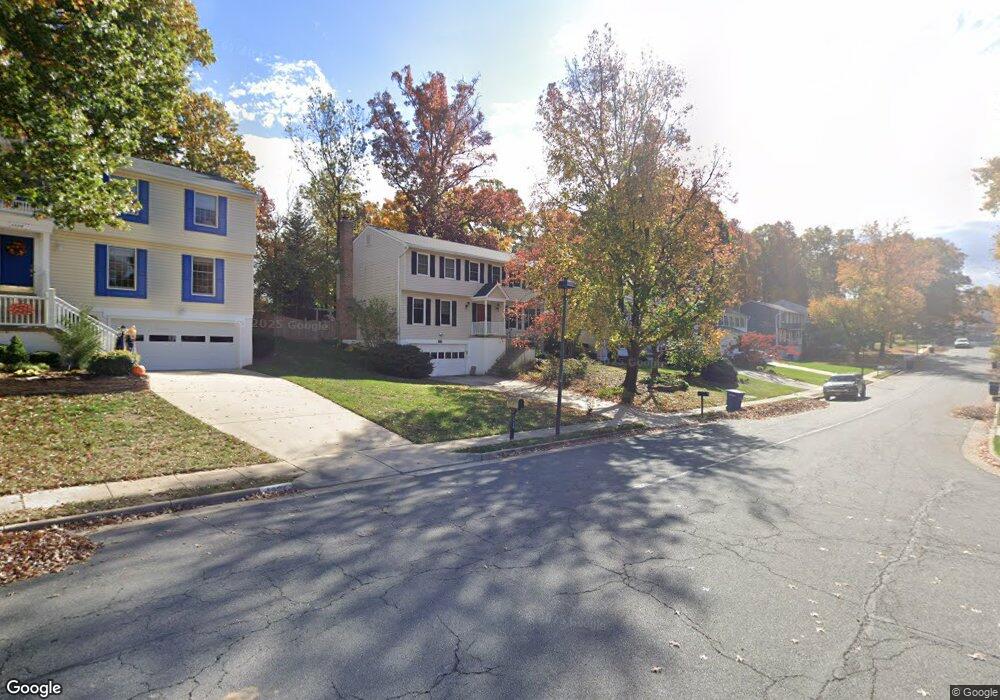
1322 Grant St Herndon, VA 20170
Estimated Value: $797,000 - $874,000
5
Beds
4
Baths
2,420
Sq Ft
$343/Sq Ft
Est. Value
About This Home
This home is located at 1322 Grant St, Herndon, VA 20170 and is currently estimated at $830,785, approximately $343 per square foot. 1322 Grant St is a home located in Fairfax County with nearby schools including Herndon Elementary, Herndon Middle School, and Herndon High School.
Ownership History
Date
Name
Owned For
Owner Type
Purchase Details
Closed on
Oct 18, 2024
Sold by
Miller Christine Ann
Bought by
Revocable Trust Of Christine Ann Miller and Miller
Current Estimated Value
Purchase Details
Closed on
Jun 8, 2001
Sold by
Fruitman Michael P
Bought by
Tripp Elise B
Home Financials for this Owner
Home Financials are based on the most recent Mortgage that was taken out on this home.
Original Mortgage
$149,362
Interest Rate
7.09%
Purchase Details
Closed on
Sep 29, 1995
Sold by
Deluca James C
Bought by
Miller Benjamin H
Home Financials for this Owner
Home Financials are based on the most recent Mortgage that was taken out on this home.
Original Mortgage
$162,400
Interest Rate
7.89%
Create a Home Valuation Report for This Property
The Home Valuation Report is an in-depth analysis detailing your home's value as well as a comparison with similar homes in the area
Home Values in the Area
Average Home Value in this Area
Purchase History
| Date | Buyer | Sale Price | Title Company |
|---|---|---|---|
| Revocable Trust Of Christine Ann Miller | -- | None Listed On Document | |
| Tripp Elise B | -- | -- | |
| Miller Benjamin H | $203,000 | -- |
Source: Public Records
Mortgage History
| Date | Status | Borrower | Loan Amount |
|---|---|---|---|
| Previous Owner | Tripp Elise B | $149,362 | |
| Previous Owner | Miller Benjamin H | $162,400 | |
| Closed | Miller Benjamin H | $20,000 |
Source: Public Records
Tax History Compared to Growth
Tax History
| Year | Tax Paid | Tax Assessment Tax Assessment Total Assessment is a certain percentage of the fair market value that is determined by local assessors to be the total taxable value of land and additions on the property. | Land | Improvement |
|---|---|---|---|---|
| 2025 | $10,005 | $715,750 | $290,000 | $425,750 |
| 2024 | $10,005 | $705,340 | $290,000 | $415,340 |
| 2023 | $9,191 | $661,940 | $290,000 | $371,940 |
| 2022 | $8,950 | $635,460 | $270,000 | $365,460 |
| 2021 | $6,547 | $557,910 | $231,000 | $326,910 |
| 2020 | $6,682 | $564,580 | $231,000 | $333,580 |
| 2019 | $6,371 | $538,280 | $231,000 | $307,280 |
| 2018 | $6,299 | $547,780 | $231,000 | $316,780 |
| 2017 | $6,186 | $532,780 | $216,000 | $316,780 |
| 2016 | $5,725 | $494,130 | $206,000 | $288,130 |
| 2015 | $5,221 | $467,820 | $196,000 | $271,820 |
| 2014 | $5,209 | $467,820 | $196,000 | $271,820 |
Source: Public Records
Map
Nearby Homes
- 903 Young Dairy Ct
- 1372 Dominion Ridge Ln
- 1191 Monroe St
- 12520 Ridgegate Dr
- 12703 Longleaf Ln
- 1549 Hiddenbrook Dr
- 1120 Stevenson Ct
- 1029 Kings Ct
- 1527 Hiddenbrook Dr
- 1008 Windcroft Glen Ct
- 12803 Briery River Terrace
- 1129 Player Way
- 1534 Youngs Point Place
- 1018 Knight Ln
- 401 Cavendish St
- 909 Ashburn St
- 488 Montalto Dr
- 12592 Rock Ridge Rd
- 12649 Terrymill Dr
- 12127 Eddyspark Dr