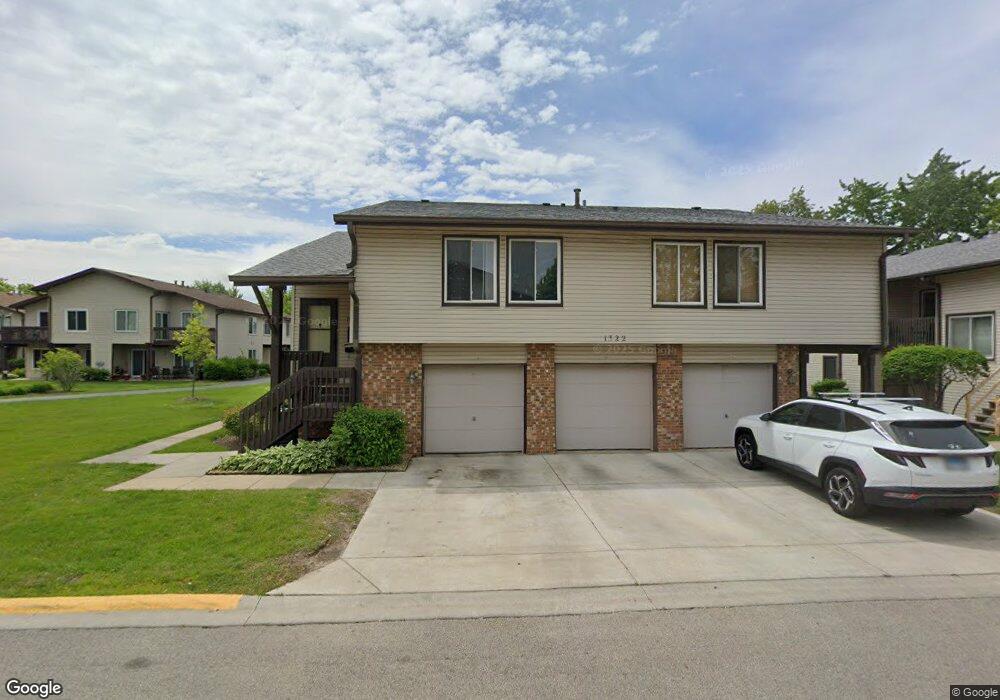
1322 Kingsbury Dr Unit 331 Hanover Park, IL 60133
Estimated Value: $225,044 - $255,000
3
Beds
--
Bath
1,200
Sq Ft
$197/Sq Ft
Est. Value
About This Home
This home is located at 1322 Kingsbury Dr Unit 331, Hanover Park, IL 60133 and is currently estimated at $236,761, approximately $197 per square foot. 1322 Kingsbury Dr Unit 331 is a home located in Cook County with nearby schools including Albert Einstein Elementary School, Jane Addams Junior High School, and Hoffman Estates High School.
Ownership History
Date
Name
Owned For
Owner Type
Purchase Details
Closed on
Jun 24, 2002
Sold by
Tomaszczyk Artur and Tomaszczyk Bozena
Bought by
Karajic Mirsad and Karajic Hasema
Current Estimated Value
Home Financials for this Owner
Home Financials are based on the most recent Mortgage that was taken out on this home.
Original Mortgage
$100,000
Outstanding Balance
$42,312
Interest Rate
6.82%
Mortgage Type
Stand Alone First
Estimated Equity
$194,449
Purchase Details
Closed on
Apr 1, 1998
Sold by
Carroll Holly C
Bought by
Tomaszczyk Artur and Tomaszczyk Bozena
Home Financials for this Owner
Home Financials are based on the most recent Mortgage that was taken out on this home.
Original Mortgage
$79,800
Interest Rate
7.19%
Purchase Details
Closed on
Apr 11, 1996
Sold by
First Bank Of Schaumburg
Bought by
Carroll Holly C
Create a Home Valuation Report for This Property
The Home Valuation Report is an in-depth analysis detailing your home's value as well as a comparison with similar homes in the area
Home Values in the Area
Average Home Value in this Area
Purchase History
| Date | Buyer | Sale Price | Title Company |
|---|---|---|---|
| Karajic Mirsad | $125,000 | -- | |
| Tomaszczyk Artur | $84,000 | -- | |
| Carroll Holly C | -- | -- |
Source: Public Records
Mortgage History
| Date | Status | Borrower | Loan Amount |
|---|---|---|---|
| Open | Karajic Mirsad | $100,000 | |
| Previous Owner | Tomaszczyk Artur | $79,800 |
Source: Public Records
Tax History Compared to Growth
Tax History
| Year | Tax Paid | Tax Assessment Tax Assessment Total Assessment is a certain percentage of the fair market value that is determined by local assessors to be the total taxable value of land and additions on the property. | Land | Improvement |
|---|---|---|---|---|
| 2024 | $3,788 | $15,320 | $2,059 | $13,261 |
| 2023 | $3,633 | $15,320 | $2,059 | $13,261 |
| 2022 | $3,633 | $15,320 | $2,059 | $13,261 |
| 2021 | $2,513 | $10,437 | $1,346 | $9,091 |
| 2020 | $2,562 | $10,437 | $1,346 | $9,091 |
| 2019 | $2,592 | $11,687 | $1,346 | $10,341 |
| 2018 | $1,223 | $6,886 | $1,108 | $5,778 |
| 2017 | $1,224 | $6,886 | $1,108 | $5,778 |
| 2016 | $1,439 | $6,886 | $1,108 | $5,778 |
| 2015 | $1,048 | $5,577 | $1,029 | $4,548 |
| 2014 | $1,047 | $5,577 | $1,029 | $4,548 |
| 2013 | $996 | $5,577 | $1,029 | $4,548 |
Source: Public Records
Map
Nearby Homes
- 1323 Kingsbury Dr Unit 2
- 1316 Kingsbury Dr Unit 1
- 7526 Bristol Ln Unit 502
- 7523 Bristol Ln Unit A
- 1307 Kingsbury Dr Unit A
- 1283 Bristol Ln
- 7837 Huntington Cir S
- 7873 Asbury Cir S
- 7843 Kensington Ln
- 1105 Stratford Ln
- 8138 N Carrolton Ct
- 1648 Linden Ave
- 7211 Jonquil Terrace
- 7418 Nantucket Cove
- 1712 Poplar Ave
- 802 Lexington Cir
- 7138 Edgebrook Ln
- 763 Verandah Dr
- 630 S Walnut Ln
- 8181 Northway Dr
- 1322 Kingsbury Dr Unit 231
- 1322 Kingsbury Dr Unit 131
- 1322 Kingsbury Dr Unit 2
- 1321 Kingsbury Dr Unit 630
- 1321 Kingsbury Dr Unit 530
- 1321 Kingsbury Dr Unit 430
- 1321 Kingsbury Dr Unit 5
- 1321 Kingsbury Dr Unit 6
- 1321 Kingsbury Dr Unit 4
- 1330 Kingsbury Dr Unit 385
- 1330 Kingsbury Dr Unit 386
- 1330 Kingsbury Dr Unit 384
- 1330 Kingsbury Dr Unit 6
- 1330 Kingsbury Dr Unit 5
- 1330 Kingsbury Dr Unit 4
- 1329 Kingsbury Dr Unit 376
- 1329 Kingsbury Dr Unit 374
- 1329 Kingsbury Dr Unit 375
- 1329 Kingsbury Dr Unit 4
- 1329 Kingsbury Dr Unit 5