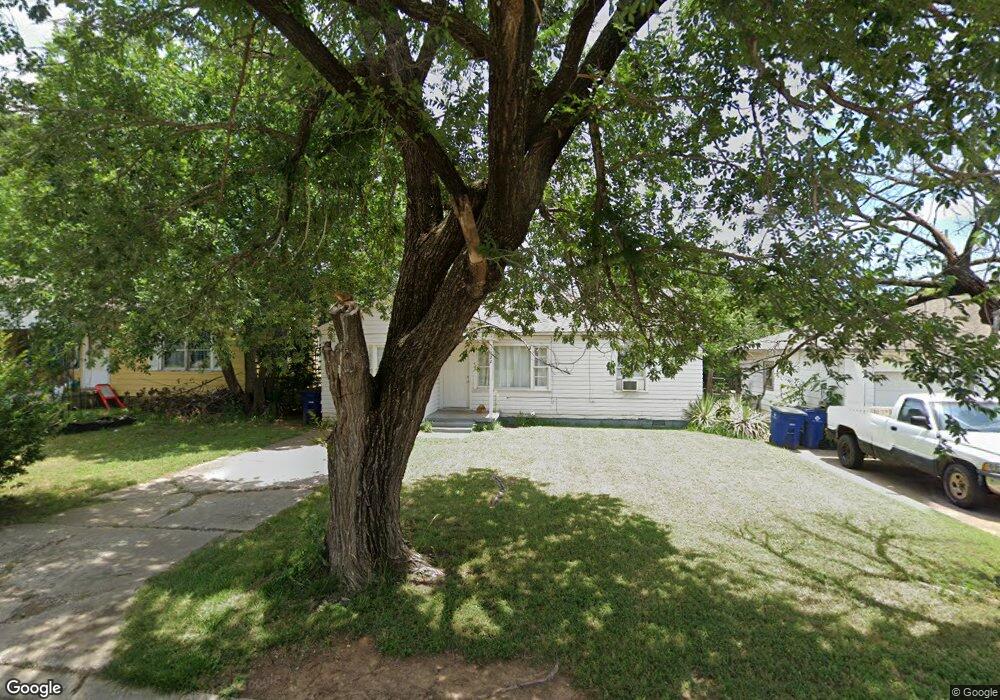
1322 N 7th St Duncan, OK 73533
Estimated Value: $56,516 - $85,000
3
Beds
1
Bath
992
Sq Ft
$71/Sq Ft
Est. Value
About This Home
This home is located at 1322 N 7th St, Duncan, OK 73533 and is currently estimated at $70,629, approximately $71 per square foot. 1322 N 7th St is a home located in Stephens County with nearby schools including Emerson Elementary School, Duncan Middle School, and Duncan High School.
Ownership History
Date
Name
Owned For
Owner Type
Purchase Details
Closed on
Dec 11, 2019
Sold by
Larry Ethridge Living Trust
Bought by
Djw Llc
Current Estimated Value
Purchase Details
Closed on
Oct 17, 2017
Sold by
Midfrist Bank
Bought by
Cornell Kent A
Purchase Details
Closed on
Aug 11, 2017
Sold by
Pendley D Cory Michael
Bought by
Midfirst Bank
Purchase Details
Closed on
Oct 5, 2007
Sold by
Wolfe Richard L and Wolfe Linda S
Bought by
Pendley Cory Michael and Pendley Jessica
Home Financials for this Owner
Home Financials are based on the most recent Mortgage that was taken out on this home.
Original Mortgage
$45,781
Interest Rate
6.32%
Mortgage Type
FHA
Purchase Details
Closed on
Mar 21, 2007
Sold by
Phelps Marjorie Lorrie
Bought by
Wolfe Richard L and Wolfe Linda S
Purchase Details
Closed on
Sep 10, 2001
Sold by
Phelps Lonny and Phelps Marjorie
Create a Home Valuation Report for This Property
The Home Valuation Report is an in-depth analysis detailing your home's value as well as a comparison with similar homes in the area
Home Values in the Area
Average Home Value in this Area
Purchase History
| Date | Buyer | Sale Price | Title Company |
|---|---|---|---|
| Djw Llc | -- | None Listed On Document | |
| Ethridge Larry | $26,500 | Stephens Co Abstract Co | |
| Cornell Kent A | $18,500 | None Available | |
| Midfirst Bank | $40,531 | None Available | |
| Pendley Cory Michael | $46,500 | None Available | |
| Wolfe Richard L | $26,000 | None Available | |
| -- | -- | -- |
Source: Public Records
Mortgage History
| Date | Status | Borrower | Loan Amount |
|---|---|---|---|
| Previous Owner | Pendley Cory Michael | $45,781 |
Source: Public Records
Tax History Compared to Growth
Tax History
| Year | Tax Paid | Tax Assessment Tax Assessment Total Assessment is a certain percentage of the fair market value that is determined by local assessors to be the total taxable value of land and additions on the property. | Land | Improvement |
|---|---|---|---|---|
| 2025 | $333 | $4,085 | $330 | $3,755 |
| 2024 | $333 | $3,891 | $330 | $3,561 |
| 2023 | $317 | $3,705 | $330 | $3,375 |
| 2022 | $250 | $2,943 | $330 | $2,613 |
| 2021 | $279 | $3,285 | $330 | $2,955 |
| 2020 | $257 | $2,980 | $330 | $2,650 |
| 2019 | $229 | $2,644 | $330 | $2,314 |
| 2018 | $235 | $2,644 | $330 | $2,314 |
| 2017 | $147 | $2,842 | $330 | $2,512 |
| 2016 | $138 | $2,628 | $330 | $2,298 |
| 2015 | $207 | $2,628 | $330 | $2,298 |
| 2014 | $207 | $2,628 | $330 | $2,298 |
Source: Public Records
Map
Nearby Homes
- 1312 Pkwy
- 1444 N 8th St
- 807 Columbus Place
- 705 W Hackberry Ave
- 1112 N 5th St
- 1229 Avalon Ave
- 1213 Avalon Ave
- 1412 N 12th St
- 1107 W Elk Ave
- 1001 1001 W Hackberry
- 1112 1112 N 12th
- 1202 N Grand Blvd
- 1800 N 5th St
- 1105 N Grand Blvd
- 1108 Rock Springs Cir
- 101 W Hackberry Ave
- 805 805 N 5th
- 1114 N 13th St
- 200 Forest Hills Dr
- 3344 3344 N 5th