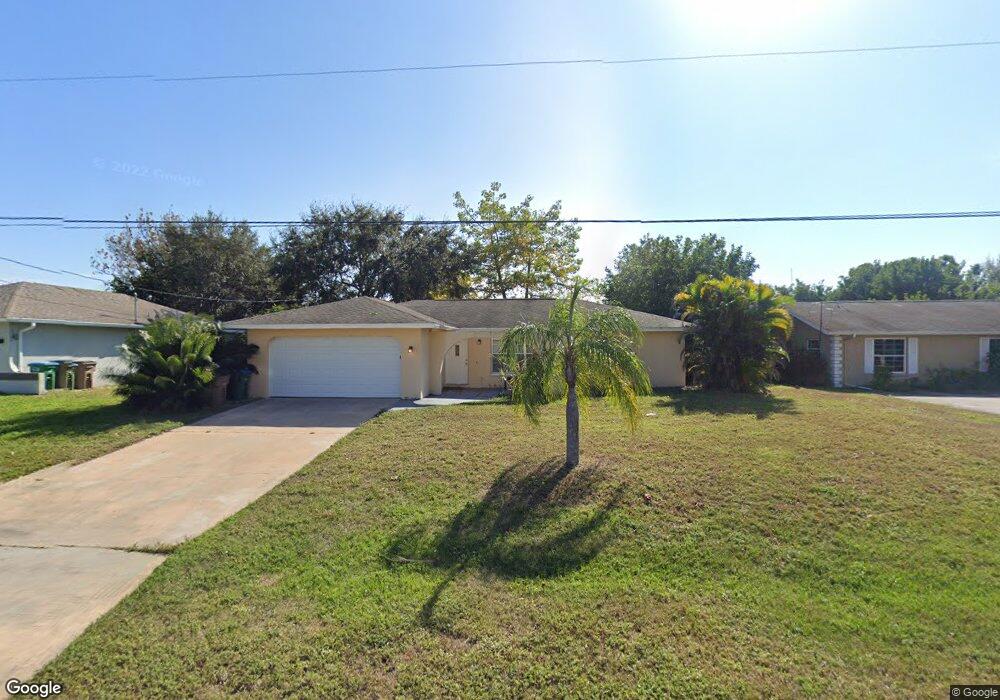
1322 SE 12th St Cape Coral, FL 33990
Hancock NeighborhoodEstimated Value: $300,108 - $497,000
4
Beds
3
Baths
1,904
Sq Ft
$192/Sq Ft
Est. Value
About This Home
This home is located at 1322 SE 12th St, Cape Coral, FL 33990 and is currently estimated at $365,027, approximately $191 per square foot. 1322 SE 12th St is a home located in Lee County with nearby schools including Caloosa Elementary School, Tropic Isles Elementary School, and Hancock Creek Elementary School.
Ownership History
Date
Name
Owned For
Owner Type
Purchase Details
Closed on
Apr 9, 2025
Sold by
Fyr Sfr Borrower Llc
Bought by
Home Sfr Borrower Llc
Current Estimated Value
Purchase Details
Closed on
Aug 8, 2018
Sold by
Rha 2 Sw Fl Llc
Bought by
Fyr Sfr Borrower Llc
Purchase Details
Closed on
Oct 24, 2014
Sold by
Zhao Llc
Bought by
Rha 2 Sw Fl Llc
Purchase Details
Closed on
Oct 27, 2011
Sold by
Federal National Mortgage Association
Bought by
Zhao Investments Llc
Purchase Details
Closed on
Sep 1, 2011
Sold by
Suntrust Mortgage Inc
Bought by
Federal National Mortgage Association
Purchase Details
Closed on
May 10, 2011
Sold by
Vale Richard
Bought by
Suntrust Mortgage Inc
Purchase Details
Closed on
Aug 24, 2007
Sold by
Sokol Richard T and Sokol Doris
Bought by
Vale Richard and Vale Debra
Home Financials for this Owner
Home Financials are based on the most recent Mortgage that was taken out on this home.
Original Mortgage
$158,000
Interest Rate
6.65%
Mortgage Type
Unknown
Create a Home Valuation Report for This Property
The Home Valuation Report is an in-depth analysis detailing your home's value as well as a comparison with similar homes in the area
Home Values in the Area
Average Home Value in this Area
Purchase History
| Date | Buyer | Sale Price | Title Company |
|---|---|---|---|
| Home Sfr Borrower Llc | $100 | Selene Title | |
| Fyr Sfr Borrower Llc | $9,430,100 | Premium Title | |
| Rha 2 Sw Fl Llc | $119,000 | Hm National Title Services | |
| Zhao Investments Llc | $69,900 | Attorney | |
| Federal National Mortgage Association | -- | Attorney | |
| Suntrust Mortgage Inc | $64,000 | None Available | |
| Vale Richard | $158,000 | Realty Title Solutions Lllp |
Source: Public Records
Mortgage History
| Date | Status | Borrower | Loan Amount |
|---|---|---|---|
| Previous Owner | Vale Richard | $158,000 |
Source: Public Records
Tax History Compared to Growth
Tax History
| Year | Tax Paid | Tax Assessment Tax Assessment Total Assessment is a certain percentage of the fair market value that is determined by local assessors to be the total taxable value of land and additions on the property. | Land | Improvement |
|---|---|---|---|---|
| 2025 | $4,537 | $252,119 | -- | -- |
| 2024 | $4,537 | $229,199 | -- | -- |
| 2023 | $4,615 | $208,363 | $0 | $0 |
| 2022 | $3,971 | $189,421 | $0 | $0 |
| 2021 | $3,556 | $172,201 | $36,161 | $136,040 |
| 2020 | $3,388 | $156,647 | $26,750 | $129,897 |
| 2019 | $3,217 | $148,580 | $25,000 | $123,580 |
| 2018 | $3,299 | $150,194 | $25,000 | $125,194 |
| 2017 | $3,210 | $155,031 | $17,000 | $138,031 |
| 2016 | $2,914 | $131,945 | $18,325 | $113,620 |
| 2015 | $2,682 | $114,108 | $15,146 | $98,962 |
| 2014 | $2,622 | $109,700 | $12,382 | $97,318 |
| 2013 | -- | $101,698 | $11,871 | $89,827 |
Source: Public Records
Map
Nearby Homes
- 1335 SE 12th St
- 1216 SE 13th Ave
- 307 SE 13th St
- 1020 SE 13th Ave
- 1234 SE 13th Ave
- 1903 SE 13th Terrace
- 1311 SE 11th St
- 1001 SE 12th Ln
- 1309 SE 10th Terrace
- 1318 SE 14th St
- 1016 SE 13th Ave
- 410 E Nicholas Pkwy
- 1039 SE 10th St
- 1432 SE 11th St
- 1421 SE 14th Terrace
- 1444 SE 11th Terrace
- 1939 SE 10th Ave
- 222 SE 10th Ave
- 1416 SE 11th Place
- 1404 SE 15th St
- 1318 SE 12th St
- 1323 SE 12th Terrace
- 1327 SE 12th Terrace
- 1319 SE 12th Terrace
- 1330 SE 12th St
- 1120 SE 13th Ct
- 1331 SE 12th Terrace
- 1315 SE 12th Terrace
- 1329 SE 12th St
- 1334 SE 12th St
- 1310 SE 12th St
- 1335 SE 12th Terrace
- 1115 SE 13th Place
- 1311 SE 12th Terrace
- 1111 SE 13th Place
- 1121 SE 13th Place
- 1112 SE 13th Ct
- 1322 SE 12th Terrace
- 1326 SE 12th Terrace
- 1331 SE 12th St