Estimated Value: $325,887 - $424,000
4
Beds
3
Baths
2,176
Sq Ft
$171/Sq Ft
Est. Value
About This Home
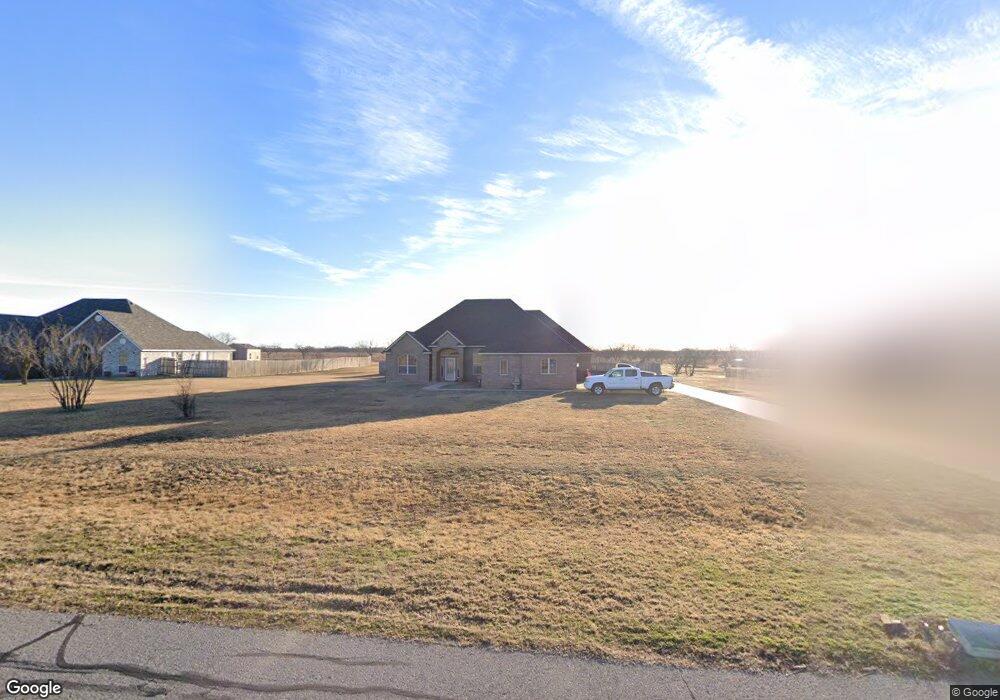
This home is located at 1322 SW Paint Rd, Cache, OK 73527 and is currently estimated at $372,972, approximately $171 per square foot. 1322 SW Paint Rd is a home located in Comanche County with nearby schools including Cache Primary Elementary School, Cache Intermediate Elementary School, and Cache Middle School.
Ownership History
Date
Name
Owned For
Owner Type
Purchase Details
Closed on
Jan 4, 2008
Sold by
Gilland Home Construction Llc
Bought by
Kerr Donald L and Kerr Betty A
Current Estimated Value
Home Financials for this Owner
Home Financials are based on the most recent Mortgage that was taken out on this home.
Original Mortgage
$215,900
Outstanding Balance
$135,022
Interest Rate
6.07%
Mortgage Type
New Conventional
Estimated Equity
$237,950
Purchase Details
Closed on
Dec 26, 2006
Sold by
Soncksen Robert L and Soncksen Tracy J
Bought by
Gilland Home Construction Llc
Purchase Details
Closed on
Oct 17, 2006
Sold by
Ayers Propertiese Llc
Bought by
Soncksen Robert L and Soncksen Tracy J
Home Financials for this Owner
Home Financials are based on the most recent Mortgage that was taken out on this home.
Original Mortgage
$12,466
Interest Rate
6.31%
Mortgage Type
Future Advance Clause Open End Mortgage
Create a Home Valuation Report for This Property
The Home Valuation Report is an in-depth analysis detailing your home's value as well as a comparison with similar homes in the area
Home Values in the Area
Average Home Value in this Area
Purchase History
| Date | Buyer | Sale Price | Title Company |
|---|---|---|---|
| Kerr Donald L | $240,000 | -- | |
| Gilland Home Construction Llc | $23,500 | -- | |
| Soncksen Robert L | $10,000 | -- |
Source: Public Records
Mortgage History
| Date | Status | Borrower | Loan Amount |
|---|---|---|---|
| Open | Kerr Donald L | $215,900 | |
| Previous Owner | Soncksen Robert L | $12,466 |
Source: Public Records
Tax History Compared to Growth
Tax History
| Year | Tax Paid | Tax Assessment Tax Assessment Total Assessment is a certain percentage of the fair market value that is determined by local assessors to be the total taxable value of land and additions on the property. | Land | Improvement |
|---|---|---|---|---|
| 2025 | $3,259 | $30,637 | $3,923 | $26,714 |
| 2024 | $3,148 | $30,102 | $4,275 | $25,827 |
| 2023 | $3,148 | $27,789 | $2,925 | $24,864 |
| 2022 | $3,100 | $27,552 | $2,925 | $24,627 |
| 2021 | $2,445 | $26,240 | $2,925 | $23,315 |
| 2020 | $2,689 | $26,526 | $2,925 | $23,601 |
| 2019 | $2,705 | $26,526 | $2,925 | $23,601 |
| 2018 | $2,791 | $27,045 | $2,925 | $24,120 |
| 2017 | $2,727 | $27,305 | $2,925 | $24,380 |
| 2016 | $2,621 | $26,695 | $2,531 | $24,164 |
| 2015 | $2,615 | $26,695 | $2,531 | $24,164 |
| 2014 | $2,580 | $26,695 | $2,531 | $24,164 |
Source: Public Records
Map
Nearby Homes
- 1802 SW Paint Rd
- 703 Meadow Ln
- 168 SW Crater Creek Rd
- 621 SW Eden Place
- TBD Rock Creek Estate
- 587 Spring Creek Rd
- 1215 Woodland Dr
- 1245 Woodlands Dr
- 175 NW Austin Ln
- 7020 SW Deyo Mission Rd
- 105 NW Valleybrook Dr
- 107 NW Valleybrook Dr
- 27 NW Sandy Trail Ln
- 66 NW Sandy Trail Ln
- 817 Hummingbird Dr
- 207 & 1/2 N Crater Creek Rd
- 25 SW River Bend Rd
- 5901 SW Deyo Mission Rd
- 7 NW Havenshire Cir
- 115 N Crater Creek Rd
- 1294 SW Paint Rd
- 1352 SW Paint Rd
- 1380 SW Paint Rd
- 1264 SW Paint Rd
- 1408 SW Paint Rd
- 1236 SW Paint Rd
- 1434 SW Paint Rd
- 1208 SW Paint Rd
- 1462 SW Paint Rd
- 1182 SW Paint Rd
- 1168 SW Paint Rd
- 1520 SW Paint Rd
- 1138 SW Paint Rd
- 1548 SW Paint Rd
- 1576 SW Paint Rd
- 1604 SW Paint Rd
- 14617 SW Lee Blvd
- 14591 SW Lee Blvd
- 1632 SW Paint Rd
- 14559 SW Lee Blvd