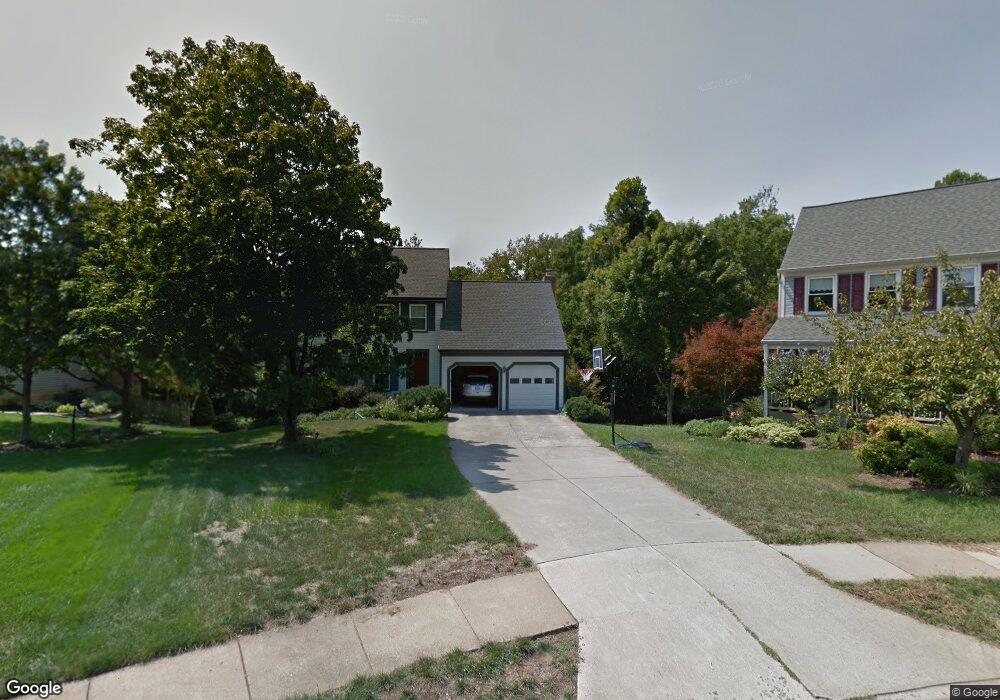
13220 Lazy Glen Ln Herndon, VA 20171
Oak Hill NeighborhoodEstimated Value: $878,000 - $939,000
4
Beds
4
Baths
2,124
Sq Ft
$425/Sq Ft
Est. Value
About This Home
This home is located at 13220 Lazy Glen Ln, Herndon, VA 20171 and is currently estimated at $902,849, approximately $425 per square foot. 13220 Lazy Glen Ln is a home located in Fairfax County with nearby schools including Oak Hill Elementary School, Rachel Carson Middle School, and Westfield High School.
Ownership History
Date
Name
Owned For
Owner Type
Purchase Details
Closed on
Apr 21, 2023
Sold by
Rice Courtney Ann
Bought by
Courtney Ann Rice Living Trust
Current Estimated Value
Purchase Details
Closed on
Oct 9, 2020
Sold by
Rice Courtney A and Rice Trevor B
Bought by
Rice Courtney A
Purchase Details
Closed on
May 20, 2005
Sold by
Carriero Alexandre
Bought by
Rice Trevor B
Home Financials for this Owner
Home Financials are based on the most recent Mortgage that was taken out on this home.
Original Mortgage
$359,000
Interest Rate
5.83%
Mortgage Type
New Conventional
Purchase Details
Closed on
Sep 24, 2004
Sold by
Kenney Francis S
Bought by
Carriero Alexandre
Home Financials for this Owner
Home Financials are based on the most recent Mortgage that was taken out on this home.
Original Mortgage
$333,700
Interest Rate
5.89%
Mortgage Type
New Conventional
Create a Home Valuation Report for This Property
The Home Valuation Report is an in-depth analysis detailing your home's value as well as a comparison with similar homes in the area
Home Values in the Area
Average Home Value in this Area
Purchase History
| Date | Buyer | Sale Price | Title Company |
|---|---|---|---|
| Courtney Ann Rice Living Trust | -- | None Listed On Document | |
| Courtney Ann Rice Living Trust | -- | None Listed On Document | |
| Rice Courtney A | -- | None Available | |
| Rice Trevor B | $660,000 | -- | |
| Carriero Alexandre | $573,000 | -- |
Source: Public Records
Mortgage History
| Date | Status | Borrower | Loan Amount |
|---|---|---|---|
| Previous Owner | Rice Trevor B | $359,000 | |
| Previous Owner | Carriero Alexandre | $333,700 |
Source: Public Records
Tax History Compared to Growth
Tax History
| Year | Tax Paid | Tax Assessment Tax Assessment Total Assessment is a certain percentage of the fair market value that is determined by local assessors to be the total taxable value of land and additions on the property. | Land | Improvement |
|---|---|---|---|---|
| 2025 | $8,933 | $815,270 | $319,000 | $496,270 |
| 2024 | $8,933 | $771,090 | $299,000 | $472,090 |
| 2023 | $8,299 | $735,440 | $294,000 | $441,440 |
| 2022 | $8,304 | $726,200 | $289,000 | $437,200 |
| 2021 | $7,629 | $650,070 | $249,000 | $401,070 |
| 2020 | $7,465 | $630,770 | $244,000 | $386,770 |
| 2019 | $7,262 | $613,620 | $234,000 | $379,620 |
| 2018 | $7,106 | $617,870 | $234,000 | $383,870 |
| 2017 | $6,925 | $596,470 | $219,000 | $377,470 |
| 2016 | $6,910 | $596,470 | $219,000 | $377,470 |
| 2015 | $6,392 | $572,730 | $209,000 | $363,730 |
| 2014 | $6,177 | $554,770 | $199,000 | $355,770 |
Source: Public Records
Map
Nearby Homes
- 2913 Mother Well Ct
- 13127 Frog Hollow Ct
- 2969 Mother Well Ct
- 3001 Mcmaster Ct
- 13009 Farthingale Dr
- 3025 Hughsmith Ct
- 13505 Clear Lake Ct
- 13104 Meadow Hall Ct
- 13019 Bankfoot Ct
- 13032 Monterey Estates Dr
- 3220 Kinross Cir
- 12817 Framingham Ct
- 13103 Anvil Place
- 3252 Tayloe Ct
- 12732 Bradwell Rd
- 3256 Tayloe Ct
- 3350 Stone Heather Ct
- 13723 Neil Armstrong Ave Unit 503
- 2653 Fanieul Hall Ct
- 13486 Foxlease Ct
- 13223 Lazy Glen Ln
- 13218 Lazy Glen Ln
- 13215 Lazy Glen Ln
- 13216 Lazy Glen Ln
- 13221 Lazy Glen Ln
- 13213 Lazy Glen Ln
- 13244 Pleasant Glen Ct
- 13217 Lazy Glen Ln
- 13243 Pleasant Glen Ct
- 13242 Pleasant Glen Ct
- 13214 Lazy Glen Ln
- 13219 Lazy Glen Ln
- 2906 Parklawn Ct
- 13211 Lazy Glen Ln
- 13241 Pleasant Glen Ct
- 13240 Pleasant Glen Ct
- 13212 Lazy Glen Ln
- 2904 Parklawn Ct
- 2908 Parklawn Ct
- 2910 Parklawn Ct