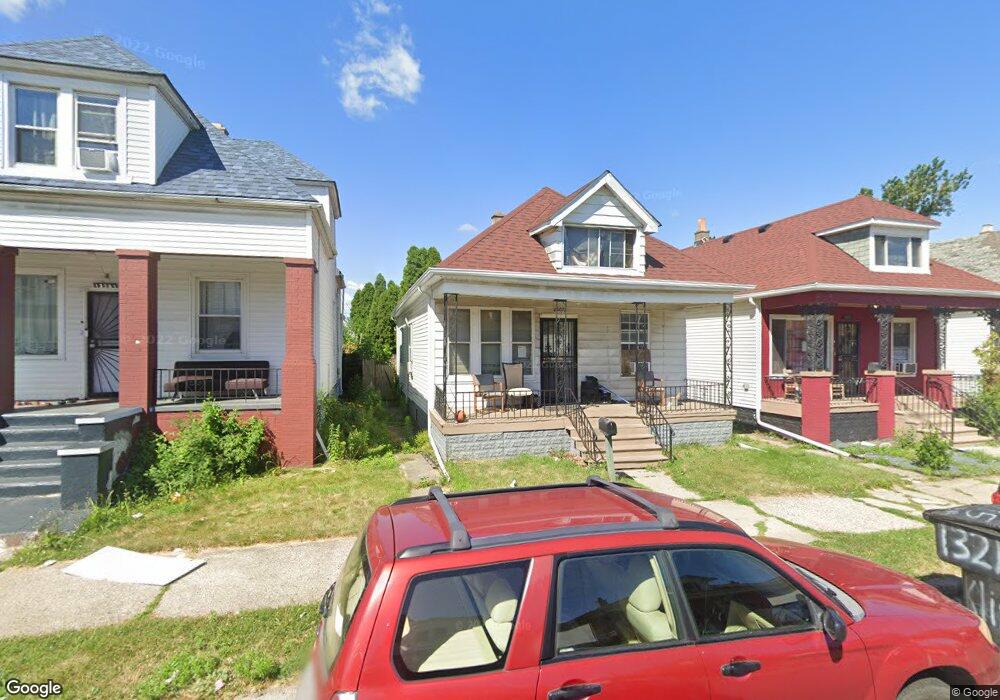
13221 Klinger St HamtraMcK, MI 48212
Campau-Banglatown NeighborhoodEstimated Value: $142,993 - $174,000
3
Beds
2
Baths
900
Sq Ft
$181/Sq Ft
Est. Value
About This Home
This home is located at 13221 Klinger St, HamtraMcK, MI 48212 and is currently estimated at $162,498, approximately $180 per square foot. 13221 Klinger St is a home located in Wayne County with nearby schools including Davison Elementary-Middle School, Charles L. Spain Elementary-Middle School, and Edward 'Duke' Ellington Conservatory of Music and Art.
Ownership History
Date
Name
Owned For
Owner Type
Purchase Details
Closed on
Jul 25, 2025
Sold by
Faruque Omar
Bought by
Sultana Abeda
Current Estimated Value
Purchase Details
Closed on
Jan 13, 2015
Sold by
Ibrahim Hafez and Ibrahim Rokeya B
Bought by
Faruque Omar
Purchase Details
Closed on
Jan 1, 2013
Sold by
Southwest Housing Solutions Corporation
Bought by
Amazing Blue Capital
Purchase Details
Closed on
Sep 28, 2012
Sold by
The Bank Of New York Mellon
Bought by
Southwest Housing Solutions Corporation
Purchase Details
Closed on
Nov 17, 2011
Sold by
Begum Minara and Khalak Abdul
Bought by
The Bank Of New York Mellon and The Bank Of New York
Purchase Details
Closed on
Sep 12, 2000
Sold by
Akter Laila
Bought by
Begum Minara
Purchase Details
Closed on
Sep 29, 1994
Sold by
Est Natalia Hryhorczuk
Bought by
Mohammed A Noor
Purchase Details
Closed on
Jun 22, 1994
Sold by
Sabornido Josefina C
Bought by
Natalia Hryhorczuk Estate
Create a Home Valuation Report for This Property
The Home Valuation Report is an in-depth analysis detailing your home's value as well as a comparison with similar homes in the area
Home Values in the Area
Average Home Value in this Area
Purchase History
| Date | Buyer | Sale Price | Title Company |
|---|---|---|---|
| Sultana Abeda | -- | None Listed On Document | |
| Sultana Abeda | -- | None Listed On Document | |
| Faruque Omar | -- | None Available | |
| Amazing Blue Capital | -- | None Available | |
| Southwest Housing Solutions Corporation | -- | None Available | |
| The Bank Of New York Mellon | $88,571 | None Available | |
| Begum Minara | $14,000 | -- | |
| Mohammed A Noor | $5,500 | -- | |
| Natalia Hryhorczuk Estate | $5,000 | -- |
Source: Public Records
Tax History
| Year | Tax Paid | Tax Assessment Tax Assessment Total Assessment is a certain percentage of the fair market value that is determined by local assessors to be the total taxable value of land and additions on the property. | Land | Improvement |
|---|---|---|---|---|
| 2025 | $708 | $17,500 | $0 | $0 |
| 2024 | $695 | $14,800 | $0 | $0 |
| 2023 | $673 | $9,500 | $0 | $0 |
| 2022 | $708 | $9,900 | $0 | $0 |
| 2021 | $692 | $6,545 | $0 | $0 |
| 2020 | $692 | $7,000 | $0 | $0 |
| 2019 | $684 | $5,040 | $0 | $0 |
| 2018 | $617 | $4,900 | $0 | $0 |
| 2017 | $91 | $4,800 | $0 | $0 |
| 2016 | $925 | $12,300 | $0 | $0 |
| 2015 | $910 | $9,100 | $0 | $0 |
| 2013 | $1,142 | $11,421 | $0 | $0 |
| 2010 | -- | $16,745 | $443 | $16,302 |
Source: Public Records
Map
Nearby Homes
- 12660 Gallagher St
- 12621 Moran St
- 13486 Gallagher St
- 12624 Charest St
- 3346 Meade St
- 13402 Dean St
- 12511 Gallagher St
- 13826 Gallagher St
- 13582 Shields St
- 12309 Klinger St
- 13401 Justine St
- 3875 Sobieski St
- 4994 Carpenter Ave
- 17144 Justine St
- 13479 Mackay St
- 13544 Hasse St
- 12099 Klinger St
- 12140 Mitchell St
- 3935 Caely St
- 2438 Burnside St
- 13227 Klinger St
- 13215 Klinger St
- 13209 Klinger St
- 13233 Klinger St
- 13239 Klinger St
- 13201 Klinger St
- 3347 Dearing St
- 3340 Grant St
- 3341 Dearing St
- 13222 Klinger St
- 13216 Klinger St
- 13230 Klinger St
- 13212 Klinger St
- 3335 Dearing St
- 3334 Grant St
- 13234 Klinger St
- 13208 Klinger St
- 13139 Klinger St
- 13240 Klinger St
- 3328 Grant St