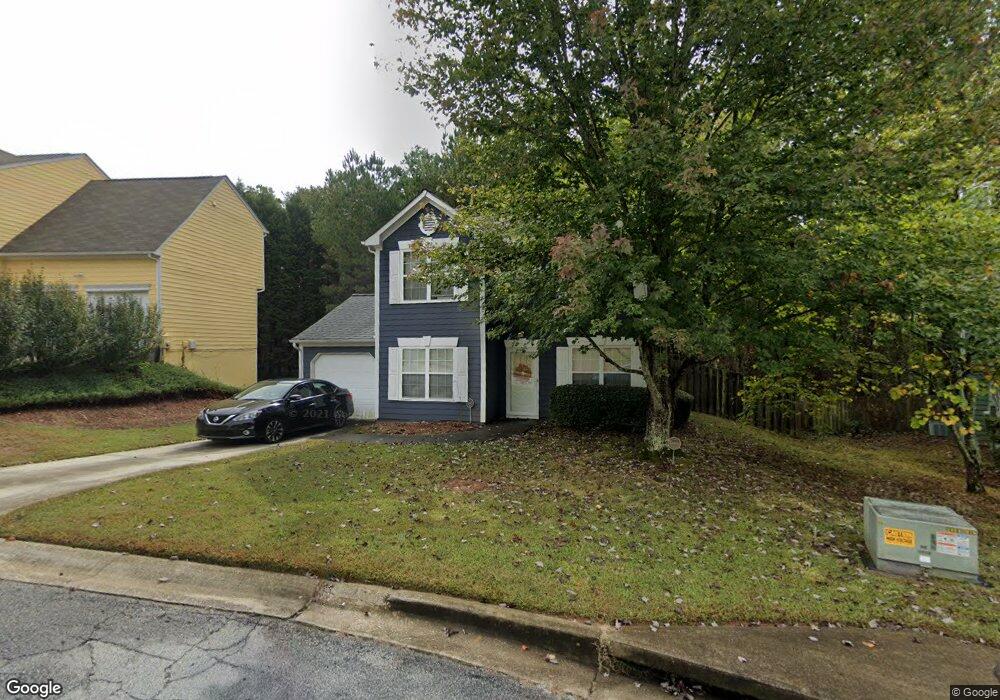
1323 Ambercrest Way Austell, GA 30168
Estimated Value: $268,195 - $315,000
3
Beds
3
Baths
1,390
Sq Ft
$203/Sq Ft
Est. Value
About This Home
This home is located at 1323 Ambercrest Way, Austell, GA 30168 and is currently estimated at $282,049, approximately $202 per square foot. 1323 Ambercrest Way is a home located in Cobb County with nearby schools including Bryant Elementary School, Lindley Middle School, and Pebblebrook High School.
Ownership History
Date
Name
Owned For
Owner Type
Purchase Details
Closed on
Aug 16, 2006
Sold by
Thomas-Fitts Ursula
Bought by
Brown Lisa M
Current Estimated Value
Home Financials for this Owner
Home Financials are based on the most recent Mortgage that was taken out on this home.
Original Mortgage
$27,800
Interest Rate
6.73%
Mortgage Type
Stand Alone Refi Refinance Of Original Loan
Purchase Details
Closed on
Jul 29, 2003
Sold by
Manns Ladawn A
Bought by
Thomas and Thomas Fitts Ursula
Home Financials for this Owner
Home Financials are based on the most recent Mortgage that was taken out on this home.
Original Mortgage
$129,900
Interest Rate
5.42%
Mortgage Type
New Conventional
Purchase Details
Closed on
Sep 30, 1997
Sold by
D R Horton Inc & Torrey
Bought by
Manns Ladawn A
Home Financials for this Owner
Home Financials are based on the most recent Mortgage that was taken out on this home.
Original Mortgage
$94,491
Interest Rate
7.6%
Mortgage Type
FHA
Create a Home Valuation Report for This Property
The Home Valuation Report is an in-depth analysis detailing your home's value as well as a comparison with similar homes in the area
Home Values in the Area
Average Home Value in this Area
Purchase History
| Date | Buyer | Sale Price | Title Company |
|---|---|---|---|
| Brown Lisa M | $139,000 | -- | |
| Thomas | $129,900 | -- | |
| Manns Ladawn A | $96,800 | -- |
Source: Public Records
Mortgage History
| Date | Status | Borrower | Loan Amount |
|---|---|---|---|
| Previous Owner | Brown Lisa M | $27,800 | |
| Previous Owner | Thomas | $129,900 | |
| Previous Owner | Manns Ladawn A | $94,491 |
Source: Public Records
Tax History Compared to Growth
Tax History
| Year | Tax Paid | Tax Assessment Tax Assessment Total Assessment is a certain percentage of the fair market value that is determined by local assessors to be the total taxable value of land and additions on the property. | Land | Improvement |
|---|---|---|---|---|
| 2025 | $2,538 | $109,464 | $24,000 | $85,464 |
| 2024 | $2,243 | $95,772 | $24,000 | $71,772 |
| 2023 | $1,468 | $85,072 | $16,000 | $69,072 |
| 2022 | $2,026 | $85,072 | $16,000 | $69,072 |
| 2021 | $1,528 | $62,328 | $10,800 | $51,528 |
| 2020 | $1,528 | $62,328 | $10,800 | $51,528 |
| 2019 | $941 | $40,012 | $6,000 | $34,012 |
| 2018 | $941 | $40,012 | $6,000 | $34,012 |
| 2017 | $826 | $37,656 | $6,000 | $31,656 |
| 2016 | $827 | $37,656 | $6,000 | $31,656 |
| 2015 | $623 | $29,992 | $6,000 | $23,992 |
| 2014 | $629 | $29,992 | $0 | $0 |
Source: Public Records
Map
Nearby Homes
- Redbud-Townhome Plan at Park Center Pointe - Hometown Series
- Bayberry-Townhome Plan at Park Center Pointe - Hometown Series
- 1311 Park Center Cir
- Wisteria-Townhome Plan at Park Center Pointe - Hometown Series
- 1163 Park Center Cir
- 1182 Park Center Cir
- 1186 Park Center Cir
- 1211 Ling Way
- 1203 Park Center Cir
- 1199 Park Center Cir
- 1195 Park Center Cir
- 7254 Silverton Trail
- 1243 Blairs Pointe Dr Unit 3
- 1395 Ling Dr Unit 2
- 7147 Walton Reserve Ln
- 6810 Panda Dr Unit B
- 6811 Panda Dr Unit A
- 1507 Locust Log Way
- 1327 Ambercrest Way
- 1319 Ambercrest Way
- 1331 Ambercrest Way
- 1318 Ambercrest Way
- 1405 Creedmore Ct
- 1335 Ambercrest Way
- 1314 Ambercrest Way
- 1326 Ambercrest Way
- 1311 Ambercrest Way
- 1401 Creedmore Ct
- 1339 Ambercrest Way
- 1404 Creedmore Ct
- 1334 Ambercrest Way
- 1400 Creedmore Ct
- 1310 Ambercrest Way
- 7121 Ambercrest Ct
- 1305 Ambercrest Way
- 1343 Ambercrest Way
- 0 Ambercrest Way
- 1306 Ambercrest Way