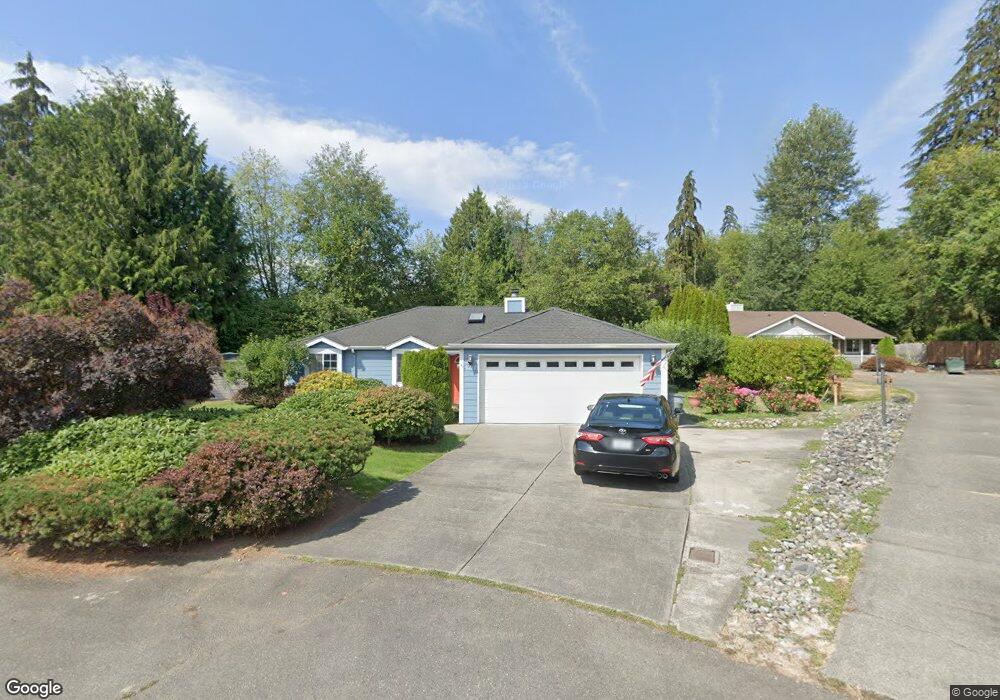
1323 Farallone Ave Fircrest, WA 98466
Estimated Value: $556,000 - $565,000
3
Beds
2
Baths
1,280
Sq Ft
$438/Sq Ft
Est. Value
About This Home
This home is located at 1323 Farallone Ave, Fircrest, WA 98466 and is currently estimated at $560,981, approximately $438 per square foot. 1323 Farallone Ave is a home located in Pierce County with nearby schools including Evergreen Primary School, Narrows View Intermediate School, and Curtis Junior High School.
Ownership History
Date
Name
Owned For
Owner Type
Purchase Details
Closed on
Oct 16, 2008
Sold by
Williams Dorothy C and Peters Dorothy C
Bought by
Varghese Kuruvila and Brigget Clara
Current Estimated Value
Home Financials for this Owner
Home Financials are based on the most recent Mortgage that was taken out on this home.
Original Mortgage
$257,244
Outstanding Balance
$170,073
Interest Rate
6.31%
Mortgage Type
FHA
Estimated Equity
$390,908
Purchase Details
Closed on
Dec 20, 2000
Sold by
Wald Kirk J
Bought by
Peters Dorothy C
Home Financials for this Owner
Home Financials are based on the most recent Mortgage that was taken out on this home.
Original Mortgage
$143,075
Interest Rate
7.81%
Purchase Details
Closed on
Apr 22, 1999
Sold by
Wald Kirk J
Bought by
Wald Kirk J and Wald Laura Sue
Home Financials for this Owner
Home Financials are based on the most recent Mortgage that was taken out on this home.
Original Mortgage
$116,500
Interest Rate
7.1%
Create a Home Valuation Report for This Property
The Home Valuation Report is an in-depth analysis detailing your home's value as well as a comparison with similar homes in the area
Home Values in the Area
Average Home Value in this Area
Purchase History
| Date | Buyer | Sale Price | Title Company |
|---|---|---|---|
| Varghese Kuruvila | $260,000 | First American Title Ins Co | |
| Peters Dorothy C | $171,601 | Commonwealth Title Co | |
| Wald Kirk J | -- | First American Title Co |
Source: Public Records
Mortgage History
| Date | Status | Borrower | Loan Amount |
|---|---|---|---|
| Open | Varghese Kuruvila | $257,244 | |
| Previous Owner | Peters Dorothy C | $143,075 | |
| Previous Owner | Wald Kirk J | $116,500 |
Source: Public Records
Tax History Compared to Growth
Tax History
| Year | Tax Paid | Tax Assessment Tax Assessment Total Assessment is a certain percentage of the fair market value that is determined by local assessors to be the total taxable value of land and additions on the property. | Land | Improvement |
|---|---|---|---|---|
| 2025 | $4,357 | $504,000 | $273,800 | $230,200 |
| 2024 | $4,357 | $456,900 | $262,600 | $194,300 |
| 2023 | $4,357 | $468,000 | $271,600 | $196,400 |
| 2022 | $4,176 | $471,700 | $271,600 | $200,100 |
| 2021 | $4,065 | $349,900 | $184,700 | $165,200 |
| 2019 | $3,036 | $315,000 | $156,100 | $158,900 |
| 2018 | $3,347 | $295,900 | $144,300 | $151,600 |
| 2017 | $2,901 | $261,200 | $118,000 | $143,200 |
| 2016 | $2,870 | $205,600 | $90,200 | $115,400 |
| 2014 | $2,740 | $201,200 | $90,200 | $111,000 |
| 2013 | $2,740 | $185,500 | $81,200 | $104,300 |
Source: Public Records
Map
Nearby Homes
- 1324 Boise St
- 1310 Boise St Unit 2
- 137 Maple St
- 142 Spruce St
- 4211 Shoshone St W
- 106 Holly Ct
- 1450 Alameda Ave Unit 1
- 1322 W Mount Dr
- 3902 Mason Loop Rd
- 914 Alameda Ave
- 906 Forrest Park Dr
- 3636 S Tyler St
- 3619 S Tyler St
- 5002 S 30th St Unit B3
- 5020 51st Avenue Ct W
- 3506 S Tyler St
- 4909 S Mullen St
- 3936 S Tyler St
- 3622 S Gunnison St
- 5523 53rd St W
- 1323 Farallone Ave W
- 1325 Farallone Ave
- 1319 Farallone Ave
- 306 Southcreek Ln
- 1327 Farallone Ave
- 1315 Farallone Ave
- 1311 Farallone Ave
- 302 Southcreek Ln
- 1338 Farallone Ave
- 1330 Farallone Ave
- 1334 Farallone Ave
- 1326 Farallone Ave
- 1314 Farallone Ave
- 305 Southcreek Ln
- 1318 Farallone Ave
- 301 Southcreek Ln
- 1310 Farallone Ave
- 309 Southcreek Ln
- 1322 Farallone Ave
- 1306 Farallone Ave