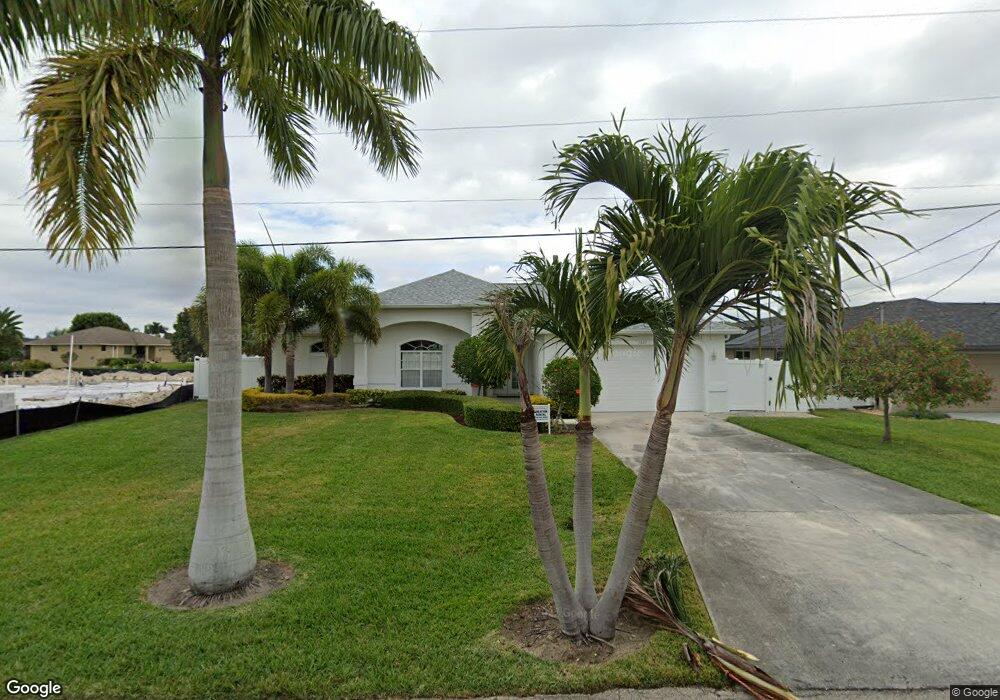
1323 SE 38th St Unit 14 Cape Coral, FL 33904
Caloosahatchee NeighborhoodEstimated Value: $502,259 - $668,000
3
Beds
2
Baths
2,436
Sq Ft
$233/Sq Ft
Est. Value
About This Home
This home is located at 1323 SE 38th St Unit 14, Cape Coral, FL 33904 and is currently estimated at $568,315, approximately $233 per square foot. 1323 SE 38th St Unit 14 is a home located in Lee County with nearby schools including Cape Elementary School, Caloosa Elementary School, and Tropic Isles Elementary School.
Ownership History
Date
Name
Owned For
Owner Type
Purchase Details
Closed on
Jun 21, 2019
Sold by
Lucie Kubec Jiri and Lucie Kubcova
Bought by
Holcombe Kevin and Holcombe Kimberly
Current Estimated Value
Purchase Details
Closed on
May 26, 2015
Sold by
Schmidt Joachim and Schmidt Ulrike
Bought by
Lucie Kubec Jiri and Lucie Kubcova
Purchase Details
Closed on
Jun 5, 2014
Sold by
Macs 4U Llc
Bought by
Schmidt Ulrike and Schmidt Joachim
Purchase Details
Closed on
May 27, 2013
Sold by
Seseke Lothar and Lange Suzanne
Bought by
Macs 4U Llc
Purchase Details
Closed on
Sep 15, 1999
Sold by
Gross Allen F and Gross Donna K
Bought by
Seseke Lothar and Lange Suzanne
Purchase Details
Closed on
Sep 25, 1998
Sold by
Lee Robert G and Lee Carol J
Bought by
Gross Allen F and Gross Donna K
Home Financials for this Owner
Home Financials are based on the most recent Mortgage that was taken out on this home.
Original Mortgage
$20,000
Interest Rate
6.96%
Create a Home Valuation Report for This Property
The Home Valuation Report is an in-depth analysis detailing your home's value as well as a comparison with similar homes in the area
Home Values in the Area
Average Home Value in this Area
Purchase History
| Date | Buyer | Sale Price | Title Company |
|---|---|---|---|
| Holcombe Kevin | $395,000 | Accurate Complete Title Inc | |
| Lucie Kubec Jiri | $315,000 | Integrity Title & Document S | |
| Schmidt Ulrike | -- | None Available | |
| Macs 4U Llc | $289,500 | Omnione Title Services Llc | |
| Seseke Lothar | $174,500 | -- | |
| Gross Allen F | $33,800 | -- |
Source: Public Records
Mortgage History
| Date | Status | Borrower | Loan Amount |
|---|---|---|---|
| Previous Owner | Gross Allen F | $20,000 |
Source: Public Records
Tax History Compared to Growth
Tax History
| Year | Tax Paid | Tax Assessment Tax Assessment Total Assessment is a certain percentage of the fair market value that is determined by local assessors to be the total taxable value of land and additions on the property. | Land | Improvement |
|---|---|---|---|---|
| 2025 | $7,462 | $480,267 | -- | -- |
| 2024 | $8,035 | $463,416 | $146,134 | $239,829 |
| 2023 | $8,035 | $413,776 | $0 | $0 |
| 2022 | $7,365 | $376,160 | $0 | $0 |
| 2021 | $6,525 | $342,479 | $137,369 | $205,110 |
| 2020 | $6,194 | $310,876 | $94,000 | $216,876 |
| 2019 | $6,088 | $306,840 | $107,100 | $199,740 |
| 2018 | $5,813 | $285,039 | $102,000 | $183,039 |
| 2017 | $5,970 | $287,474 | $96,500 | $190,974 |
| 2016 | $5,627 | $267,649 | $124,369 | $143,280 |
| 2015 | $5,512 | $255,707 | $106,211 | $149,496 |
| 2014 | $4,855 | $217,796 | $79,829 | $137,967 |
| 2013 | -- | $209,808 | $64,230 | $145,578 |
Source: Public Records
Map
Nearby Homes
- 3823 SE 13th Ave
- 3725 SE 13th Ave
- 3814 SE 13th Ave
- 1313 SE 37th Terrace
- 1413 SE 39th St
- 3736 SE 15th Place
- 3902 SE 13th Ave
- 1131 SE 38th St
- 1319 SE 39th Terrace
- 3810 SE 12th Place
- 3731 SE 15th Place
- 1309 SE 37th St
- 1105 SE 38th St
- 1101 SE 38th St
- 1107 SE 38th St
- 1401 SE 36th Terrace
- 1322 SE 40th St Unit 5
- 3914 SE 12th Ave
- 3711 Del Prado Blvd S Unit 2
- 3802 SE 12th Ave
- 1327 SE 38th St Unit 14
- 1331 SE 38th St
- 1326 SE 38th St
- 1315 SE 38th St
- 1319 SE 38th St
- 3866 SE 13th Place
- 1304 SE 37th Ln
- 1308 SE 37th Ln
- 1401 SE 38th St
- 1330 SE 38th St
- 3870 SE 13th Place
- 1312 SE 37th Ln
- 3732 SE 13th Place Unit 14
- 1402 SE 38th St
- 1316 SE 37th Ln
- 3873 SE 13th Place
- 3874 SE 13th Place
- 3728 SE 13th Place
- 3815 SE 13th Ave