Estimated Value: $265,585 - $340,000
4
Beds
3
Baths
2,308
Sq Ft
$128/Sq Ft
Est. Value
About This Home
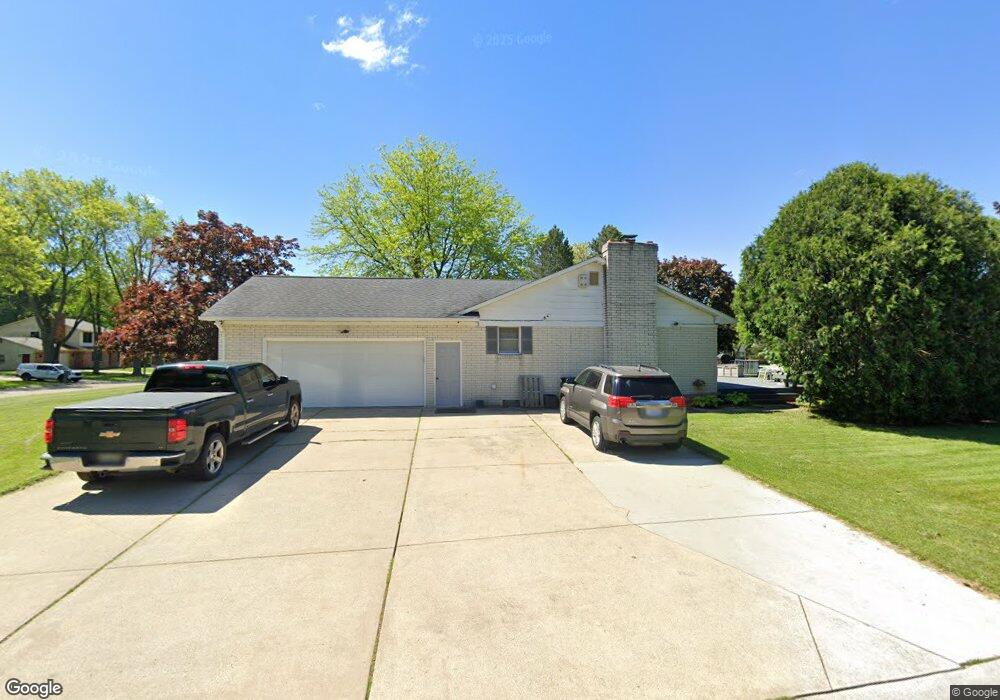
This home is located at 1323 Springborrow Dr, Flint, MI 48532 and is currently estimated at $295,646, approximately $128 per square foot. 1323 Springborrow Dr is a home located in Genesee County with nearby schools including Carman-Ainsworth High School, Genesee STEM Academy, and Linden Charter Academy.
Ownership History
Date
Name
Owned For
Owner Type
Purchase Details
Closed on
Dec 4, 2025
Sold by
Brown Bertha L and Bingham Eddie R
Bought by
Brown Bertha L and Bingham Eddie R
Current Estimated Value
Purchase Details
Closed on
Jul 17, 2015
Sold by
Bingham Eddie R and Brown Bertha L
Bought by
Bingham Eddie R
Purchase Details
Closed on
Sep 30, 2011
Sold by
Muringathery Suresh J and Muringathery Joseph Sunita
Bought by
Brown Bertha L and Bingham Eddie R
Home Financials for this Owner
Home Financials are based on the most recent Mortgage that was taken out on this home.
Original Mortgage
$121,831
Interest Rate
4.5%
Mortgage Type
FHA
Purchase Details
Closed on
Mar 30, 2001
Sold by
Decker Paul M and Pilon Janice E
Bought by
Muringathery Suresh J and Muringathery Joseph Sunita
Home Financials for this Owner
Home Financials are based on the most recent Mortgage that was taken out on this home.
Original Mortgage
$163,000
Interest Rate
7.05%
Purchase Details
Closed on
Oct 18, 1999
Sold by
Pilon Janice E
Bought by
Decker Paul M
Create a Home Valuation Report for This Property
The Home Valuation Report is an in-depth analysis detailing your home's value as well as a comparison with similar homes in the area
Home Values in the Area
Average Home Value in this Area
Purchase History
| Date | Buyer | Sale Price | Title Company |
|---|---|---|---|
| Brown Bertha L | -- | None Listed On Document | |
| Bingham Eddie R | -- | None Available | |
| Brown Bertha L | $125,000 | Cislo Title Co | |
| Muringathery Suresh J | $203,750 | Lawyers Title Insurance Corp | |
| Decker Paul M | -- | -- |
Source: Public Records
Mortgage History
| Date | Status | Borrower | Loan Amount |
|---|---|---|---|
| Previous Owner | Brown Bertha L | $121,831 | |
| Previous Owner | Muringathery Suresh J | $163,000 |
Source: Public Records
Tax History
| Year | Tax Paid | Tax Assessment Tax Assessment Total Assessment is a certain percentage of the fair market value that is determined by local assessors to be the total taxable value of land and additions on the property. | Land | Improvement |
|---|---|---|---|---|
| 2025 | $3,488 | $119,300 | $0 | $0 |
| 2024 | $1,849 | $107,300 | $0 | $0 |
| 2023 | $1,764 | $100,300 | $0 | $0 |
| 2022 | $1,476 | $95,100 | $0 | $0 |
| 2021 | $3,094 | $90,400 | $0 | $0 |
| 2020 | $1,585 | $88,800 | $0 | $0 |
| 2019 | $1,562 | $87,900 | $0 | $0 |
| 2018 | $2,877 | $73,500 | $0 | $0 |
| 2017 | $2,780 | $73,500 | $0 | $0 |
| 2016 | $2,836 | $72,900 | $0 | $0 |
| 2015 | $2,624 | $71,800 | $0 | $0 |
| 2014 | $1,556 | $69,000 | $0 | $0 |
| 2012 | -- | $64,300 | $64,300 | $0 |
Source: Public Records
Map
Nearby Homes
- Covered Wagons Trail Covered Wagons Trail
- 1260 Springborrow Dr
- 1321 Highland Meadows
- 5551 Sugar Bush Ln
- 6302 Laurentian Ct
- 6300 Laurentian Ct
- 6318 Laurentian Ct Unit Building 9 APT 42
- 5477 Fernwood Dr
- 6440 Western Way
- 00 Emeraldwood Trail
- 74 Emeraldwood Trail
- 60 Emeraldwood Trail
- 6142 Noel Dr
- 5411 River Meadow Blvd
- 6123 E River Rd
- 0 Country Ridge Trail
- 5442 Meadow Creek Ct
- 0 VACANT LAND Elms Rd
- oo Walnut Creek Dr
- 1192 Citation Dr
- 6201 Cimarron Trail
- 6182 Cimarron Trail
- 6192 Cimarron Trail
- 1320 Springborrow Dr
- 1295 Springborrow Dr
- 1332 Springborrow Dr
- 6215 Cimarron Trail
- 1308 Springborrow Dr
- 1344 Springborrow Dr
- 6179 Covered Wagons Trail
- 1296 Springborrow Dr
- 6218 Cimarron Trail
- 1283 Springborrow Dr
- 1356 Springborrow Dr
- 6191 Covered Wagons Trail
- 1284 Springborrow Dr
- 1271 Springborrow Dr
- 6172 Covered Wagons Trail
- 6156 Covered Wagons Trail
- 6203 Covered Wagons Trail
Your Personal Tour Guide
Ask me questions while you tour the home.