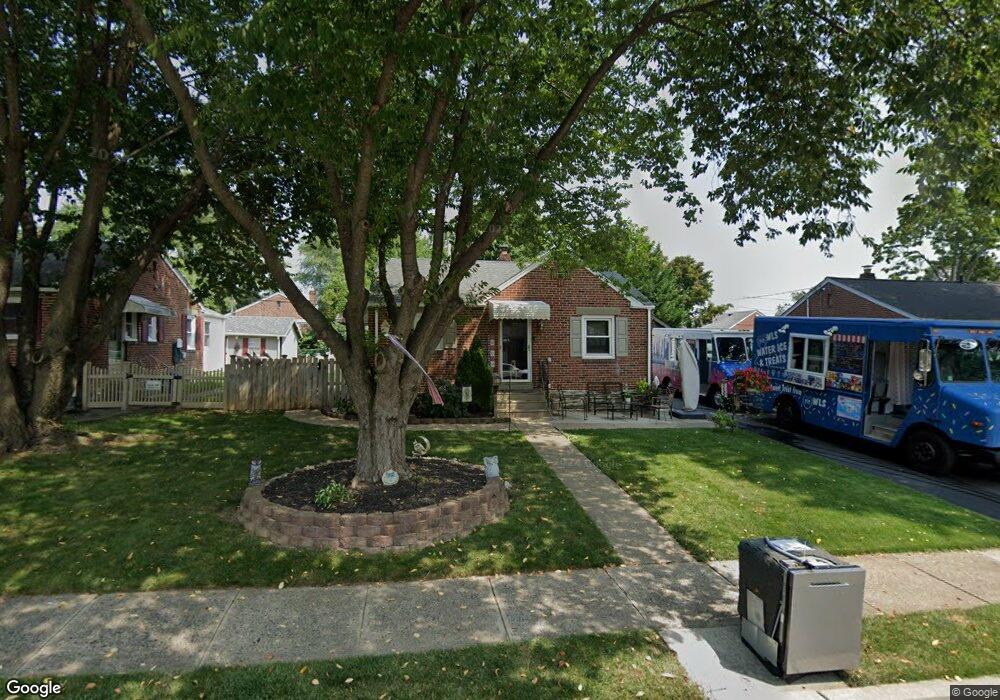
1323 Warren Ave Havertown, PA 19083
Estimated Value: $365,000 - $423,716
2
Beds
1
Bath
1,092
Sq Ft
$370/Sq Ft
Est. Value
About This Home
This home is located at 1323 Warren Ave, Havertown, PA 19083 and is currently estimated at $403,929, approximately $369 per square foot. 1323 Warren Ave is a home located in Delaware County with nearby schools including Lynnewood El School, Haverford Middle School, and Haverford Senior High School.
Ownership History
Date
Name
Owned For
Owner Type
Purchase Details
Closed on
Dec 15, 2017
Sold by
Raspa Joseph Paul
Bought by
Mele Mary
Current Estimated Value
Purchase Details
Closed on
Apr 19, 2011
Sold by
Raspa Joseph Paul and Raspa Rosa Rita
Bought by
Raspa Joseph Paul
Purchase Details
Closed on
Dec 2, 1997
Sold by
Hud
Bought by
Brotzman Robert E and Brotzman Cyntra M
Home Financials for this Owner
Home Financials are based on the most recent Mortgage that was taken out on this home.
Original Mortgage
$64,750
Interest Rate
7.11%
Mortgage Type
Purchase Money Mortgage
Purchase Details
Closed on
Aug 21, 1996
Sold by
Osborne Ann
Bought by
Hud
Purchase Details
Closed on
Jun 30, 1994
Sold by
Brotzman Robert E
Bought by
Mccarthy Francis C and Mccarthy Michele A
Home Financials for this Owner
Home Financials are based on the most recent Mortgage that was taken out on this home.
Original Mortgage
$108,896
Interest Rate
8.51%
Mortgage Type
FHA
Create a Home Valuation Report for This Property
The Home Valuation Report is an in-depth analysis detailing your home's value as well as a comparison with similar homes in the area
Home Values in the Area
Average Home Value in this Area
Purchase History
| Date | Buyer | Sale Price | Title Company |
|---|---|---|---|
| Mele Mary | -- | None Available | |
| Raspa Joseph Paul | $110,000 | None Available | |
| Brotzman Robert E | $92,501 | Commonwealth Land Title Ins | |
| Hud | -- | -- | |
| Mccarthy Francis C | $109,000 | -- |
Source: Public Records
Mortgage History
| Date | Status | Borrower | Loan Amount |
|---|---|---|---|
| Previous Owner | Brotzman Robert E | $64,750 | |
| Previous Owner | Mccarthy Francis C | $108,896 |
Source: Public Records
Tax History Compared to Growth
Tax History
| Year | Tax Paid | Tax Assessment Tax Assessment Total Assessment is a certain percentage of the fair market value that is determined by local assessors to be the total taxable value of land and additions on the property. | Land | Improvement |
|---|---|---|---|---|
| 2025 | $6,266 | $243,700 | $96,010 | $147,690 |
| 2024 | $6,266 | $243,700 | $96,010 | $147,690 |
| 2023 | $6,088 | $243,700 | $96,010 | $147,690 |
| 2022 | $5,946 | $243,700 | $96,010 | $147,690 |
| 2021 | $9,686 | $243,700 | $96,010 | $147,690 |
| 2020 | $5,232 | $112,570 | $51,590 | $60,980 |
| 2019 | $5,136 | $112,570 | $51,590 | $60,980 |
| 2018 | $5,048 | $112,570 | $0 | $0 |
| 2017 | $4,941 | $112,570 | $0 | $0 |
| 2016 | $630 | $112,570 | $0 | $0 |
| 2015 | $630 | $112,570 | $0 | $0 |
| 2014 | $630 | $112,570 | $0 | $0 |
Source: Public Records
Map
Nearby Homes
- 1447 Lawrence Rd
- 1321 Annabella Ave
- 1442 Dorchester Rd
- 2300 Oakmont Ave
- 1510 Ashton Rd
- 2424 Delchester Ave
- 1702 Tyson Rd
- 2616 Prescott Rd
- 1702 Melrose Ave
- 212 Golf Hills Rd
- 101 Rockland Rd
- 25 Oak Ln
- 41 W Hillcrest Ave
- 1529 Brierwood Rd
- 1747 W Chester Pike Unit 41
- 10 Claremont Blvd
- 164 Woodbine Rd
- 12 Claremont Blvd
- 14 Claremont Blvd
- 145 Sycamore Rd
- 1319 Warren Ave
- 1327 Warren Ave
- 709 Chester Ave
- 708 Howard Ave
- 1315 Warren Ave
- 712 Howard Ave
- 1324 Warren Ave
- 1335 Warren Ave
- 1320 Warren Ave
- 1332 Warren Ave
- 717 Chester Ave
- 1316 Warren Ave
- 716 Howard Ave
- 1336 Warren Ave
- 1312 Warren Ave
- 1339 Warren Ave
- 708 Chester Ave
- 721 Chester Ave
- 712 Chester Ave
- 705 Howard Ave