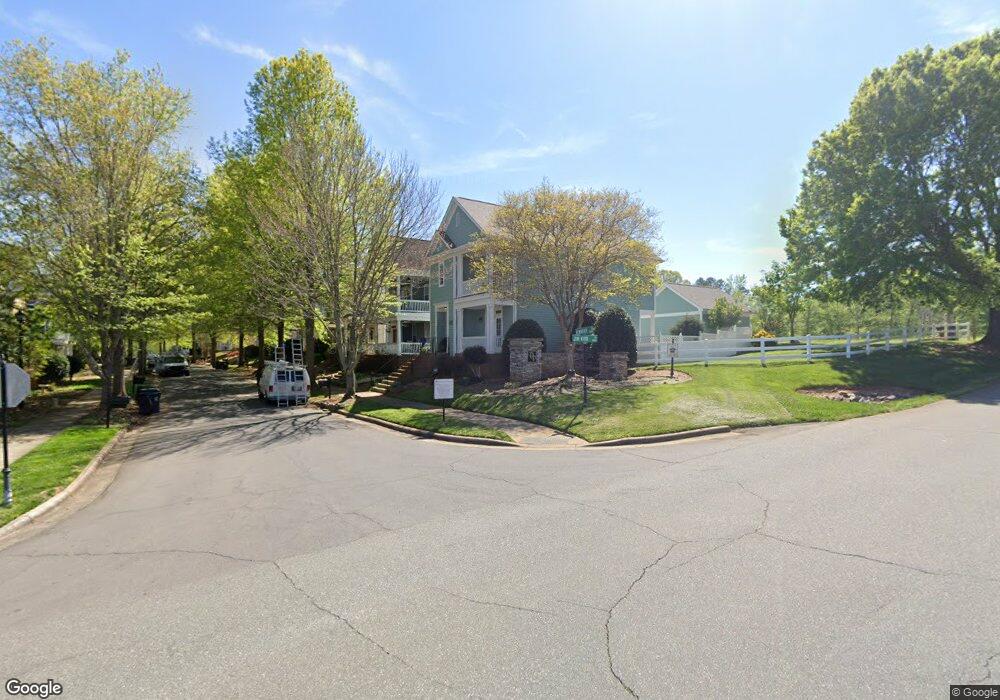
13233 Kennerly Dr Huntersville, NC 28078
Estimated Value: $398,687 - $482,000
3
Beds
3
Baths
1,831
Sq Ft
$232/Sq Ft
Est. Value
About This Home
This home is located at 13233 Kennerly Dr, Huntersville, NC 28078 and is currently estimated at $423,922, approximately $231 per square foot. 13233 Kennerly Dr is a home located in Mecklenburg County with nearby schools including Barnette Elementary School, Francis Bradley Middle School, and Hopewell High.
Ownership History
Date
Name
Owned For
Owner Type
Purchase Details
Closed on
Mar 2, 2023
Sold by
Fogle Frank Eugene and Fogle Leanne
Bought by
Yamasa Co Ltd
Current Estimated Value
Purchase Details
Closed on
Aug 10, 2018
Sold by
Fogle Frank Eugen and Kinsella Le3anne
Bought by
Fogle Frank Eugene and Fogle Leanne
Purchase Details
Closed on
Jul 30, 2012
Sold by
Fogle Frank Eugene
Bought by
Kinsella Leanne and Fogle Frank Eugene
Purchase Details
Closed on
Dec 3, 2004
Sold by
Arvida Mid Atlantic Homes Inc
Bought by
Fogle Frank
Home Financials for this Owner
Home Financials are based on the most recent Mortgage that was taken out on this home.
Original Mortgage
$132,800
Interest Rate
4.37%
Mortgage Type
Purchase Money Mortgage
Purchase Details
Closed on
Feb 15, 2002
Sold by
Jim Kidd Road Llc
Bought by
Arvida Mid Atlantic Homes Inc
Create a Home Valuation Report for This Property
The Home Valuation Report is an in-depth analysis detailing your home's value as well as a comparison with similar homes in the area
Home Values in the Area
Average Home Value in this Area
Purchase History
| Date | Buyer | Sale Price | Title Company |
|---|---|---|---|
| Yamasa Co Ltd | $355,000 | -- | |
| Fogle Frank Eugene | -- | None Available | |
| Kinsella Leanne | -- | None Available | |
| Fogle Frank | $166,000 | -- | |
| Arvida Mid Atlantic Homes Inc | $434,000 | -- |
Source: Public Records
Mortgage History
| Date | Status | Borrower | Loan Amount |
|---|---|---|---|
| Previous Owner | Fogle Frank | $132,800 | |
| Closed | Fogle Frank | $33,200 |
Source: Public Records
Tax History Compared to Growth
Tax History
| Year | Tax Paid | Tax Assessment Tax Assessment Total Assessment is a certain percentage of the fair market value that is determined by local assessors to be the total taxable value of land and additions on the property. | Land | Improvement |
|---|---|---|---|---|
| 2025 | $2,993 | $392,600 | $75,000 | $317,600 |
| 2024 | $2,993 | $392,600 | $75,000 | $317,600 |
| 2023 | $2,747 | $392,600 | $75,000 | $317,600 |
| 2022 | $2,154 | $232,000 | $57,000 | $175,000 |
| 2021 | $2,137 | $232,000 | $57,000 | $175,000 |
| 2020 | $2,112 | $228,400 | $57,000 | $171,400 |
| 2019 | $2,075 | $228,400 | $57,000 | $171,400 |
| 2018 | $2,240 | $188,700 | $40,000 | $148,700 |
| 2017 | $2,211 | $188,700 | $40,000 | $148,700 |
| 2016 | $2,207 | $188,700 | $40,000 | $148,700 |
| 2015 | $2,204 | $188,700 | $40,000 | $148,700 |
| 2014 | -- | $0 | $0 | $0 |
Source: Public Records
Map
Nearby Homes
- 13110 Kennerly Dr
- 6714 Park Meadows Place
- 7010 Carrington Pointe Dr
- 7026 Carrington Pointe Dr
- 6540 Hasley Woods Dr
- 6541 Hasley Woods Dr
- 6565 Hasley Woods Dr
- 13926 Cypress Woods Dr
- 13907 Waverton Ln
- 6402 Colonial Garden Dr
- 6118 Colonial Garden Dr Unit 213
- 12719 Vantage Point Ln
- 6213 Colonial Garden Dr
- 8901 Powder Works Dr
- 11612 Galashiels Dr
- Huntley Plan at Stephens Farm
- Balboa Plan at Stephens Farm
- Napa Plan at Stephens Farm
- Marin-Expanded Plan at Stephens Farm
- Newport II Plan at Stephens Farm
- 13229 Kennerly Dr
- 13229 Kennerly Dr Unit 2
- 13225 Kennerly Dr
- 13221 Kennerly Dr
- 13232 Kennerly Dr
- 13217 Kennerly Dr
- 13217 Kennerly Dr Unit 5
- 13224 Kennerly Dr Unit 79
- 13224 Kennerly Dr
- 13224 Kennerly Dr
- 13220 Kennerly Dr
- 13213 Kennerly Dr
- 13216 Kennerly Dr
- 13212 Kennerly Dr
- 6551 Park Meadows Place
- 6545 Park Meadows Place
- 6539 Park Meadows Place
- 6603 Park Meadows Place Unit 75
- 6607 Park Meadows Place
- 140 Carrington Ridge Dr