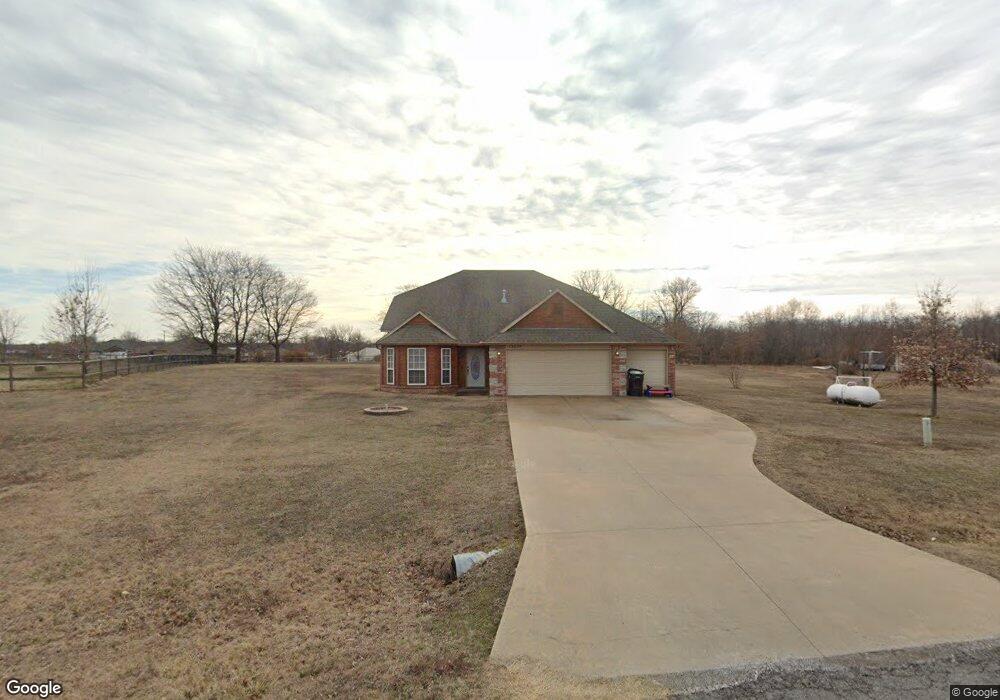
13239 Horseshoe Bend Oologah, OK 74053
Estimated Value: $309,341 - $348,000
3
Beds
3
Baths
1,807
Sq Ft
$185/Sq Ft
Est. Value
About This Home
This home is located at 13239 Horseshoe Bend, Oologah, OK 74053 and is currently estimated at $333,585, approximately $184 per square foot. 13239 Horseshoe Bend is a home located in Rogers County with nearby schools including Oologah-Talala Lower Elementary School, Oologah-Talala Upper Elementary School, and Oologah-Talala Middle School.
Ownership History
Date
Name
Owned For
Owner Type
Purchase Details
Closed on
May 28, 2009
Sold by
Taber Inc
Bought by
Moseley John H and Moseley Gina L
Current Estimated Value
Home Financials for this Owner
Home Financials are based on the most recent Mortgage that was taken out on this home.
Original Mortgage
$155,612
Outstanding Balance
$97,946
Interest Rate
4.7%
Mortgage Type
New Conventional
Estimated Equity
$235,639
Purchase Details
Closed on
Mar 9, 2009
Sold by
Sanders Kyle and Sanders Kimberly
Bought by
T Town Investments Llc
Purchase Details
Closed on
Feb 23, 2007
Sold by
Home Address Builders Inc
Bought by
Sanders Kyle and Sanders Kimberly
Home Financials for this Owner
Home Financials are based on the most recent Mortgage that was taken out on this home.
Original Mortgage
$143,225
Interest Rate
6.9%
Mortgage Type
Assumption
Purchase Details
Closed on
Sep 20, 2006
Sold by
Cherub Investments Inc
Bought by
Home Address Builders Inc
Home Financials for this Owner
Home Financials are based on the most recent Mortgage that was taken out on this home.
Original Mortgage
$131,120
Interest Rate
6.55%
Mortgage Type
Construction
Create a Home Valuation Report for This Property
The Home Valuation Report is an in-depth analysis detailing your home's value as well as a comparison with similar homes in the area
Home Values in the Area
Average Home Value in this Area
Purchase History
| Date | Buyer | Sale Price | Title Company |
|---|---|---|---|
| Moseley John H | $152,500 | Firsttitle & Abstract Servic | |
| T Town Investments Llc | $112,500 | None Available | |
| Sanders Kyle | $168,500 | Firstitle & Abstract Service | |
| Home Address Builders Inc | $21,500 | None Available |
Source: Public Records
Mortgage History
| Date | Status | Borrower | Loan Amount |
|---|---|---|---|
| Open | Moseley John H | $155,612 | |
| Previous Owner | Sanders Kyle | $143,225 | |
| Previous Owner | Home Address Builders Inc | $131,120 |
Source: Public Records
Tax History Compared to Growth
Tax History
| Year | Tax Paid | Tax Assessment Tax Assessment Total Assessment is a certain percentage of the fair market value that is determined by local assessors to be the total taxable value of land and additions on the property. | Land | Improvement |
|---|---|---|---|---|
| 2024 | $2,307 | $22,897 | $3,101 | $19,796 |
| 2023 | $2,307 | $22,230 | $2,970 | $19,260 |
| 2022 | $2,144 | $21,583 | $2,970 | $18,613 |
| 2021 | $2,094 | $20,954 | $2,970 | $17,984 |
| 2020 | $2,067 | $20,803 | $2,970 | $17,833 |
| 2019 | $1,966 | $19,805 | $2,970 | $16,835 |
| 2018 | $2,045 | $20,302 | $2,970 | $17,332 |
| 2017 | $2,098 | $19,333 | $2,970 | $16,363 |
| 2016 | $1,854 | $18,770 | $2,970 | $15,800 |
| 2015 | $1,685 | $18,223 | $2,970 | $15,253 |
| 2014 | $1,645 | $17,692 | $2,970 | $14,722 |
Source: Public Records
Map
Nearby Homes
- 2676 Creek Trail Ln
- 2330 E Cimarron Ct
- 2612 Cross Creek Dr
- 1936 Caddo St
- 12275 Elkhorn Dr
- 2979 Cross Creek Dr
- 1709 Caddo St
- 13970 S 4070 Rd
- 9 E 420 Rd
- 12 E 420 Rd
- 16012 N 145th Ave E
- 16012 N 145 Ave
- 12619 E 170th St N
- 15985 N Hwy 75
- 9730 S 4050 Rd
- 9750 S 4060 Rd
- 000 N 137th Ave E
- 1122 S Catalina Dr
- 5950 E Everetts Point
- 1112 S Marina Dr
- 13199 Horseshoe Bend
- 2400 Bridle Bit St
- 13236 Horseshoe Bend
- 2350 Bridle Bit St
- 13159 Horseshoe Bend
- 13159 Horseshoe Bend Dr
- 13196 Horseshoe Bend Dr
- 13240 Cherokee
- 13196 Horseshoe Bend
- 13200 Cherokee
- 13231 Bareback Dr
- 13160 Cherokee
- 2320 Bridle Bit St
- 13156 Horseshoe Bend
- 13191 Bareback Dr
- 13099 Horseshoe Bend
- 11701 S 4050 Rd
- 11771 S 4050 Rd
- 13120 Cherokee
- 13235 Cherokee