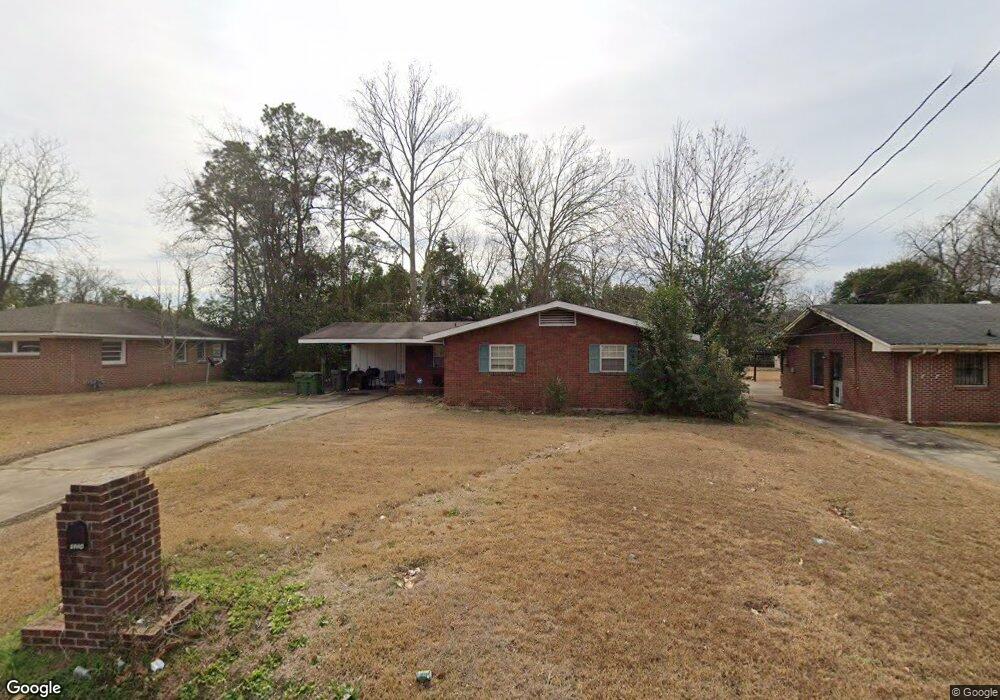
1324 Buckingham Dr Montgomery, AL 36116
Estimated Value: $91,000 - $101,000
3
Beds
2
Baths
1,136
Sq Ft
$85/Sq Ft
Est. Value
About This Home
This home is located at 1324 Buckingham Dr, Montgomery, AL 36116 and is currently estimated at $97,065, approximately $85 per square foot. 1324 Buckingham Dr is a home located in Montgomery County with nearby schools including Johnson Elementary School, McKee Middle School, and Lanier Senior High School.
Ownership History
Date
Name
Owned For
Owner Type
Purchase Details
Closed on
Oct 27, 2009
Sold by
Jackson Kayatta
Bought by
Lowery Marcus
Current Estimated Value
Purchase Details
Closed on
Apr 30, 2004
Sold by
Lowery Marcus
Bought by
Lowery Marcus and Jackson Kayatta
Purchase Details
Closed on
Jul 31, 2003
Sold by
Manora Dollie
Bought by
Lowery Marcus
Home Financials for this Owner
Home Financials are based on the most recent Mortgage that was taken out on this home.
Original Mortgage
$66,316
Interest Rate
5.42%
Mortgage Type
FHA
Purchase Details
Closed on
Apr 18, 2003
Sold by
Hud
Bought by
Manora Dollie
Home Financials for this Owner
Home Financials are based on the most recent Mortgage that was taken out on this home.
Original Mortgage
$41,000
Interest Rate
5.62%
Mortgage Type
Purchase Money Mortgage
Purchase Details
Closed on
Sep 13, 2002
Sold by
Regions Mtg Inc
Bought by
Hud
Purchase Details
Closed on
Jul 2, 2002
Sold by
Murray Nathaniel and Murray Elizabeth A
Bought by
Regions Mtg Inc
Create a Home Valuation Report for This Property
The Home Valuation Report is an in-depth analysis detailing your home's value as well as a comparison with similar homes in the area
Home Values in the Area
Average Home Value in this Area
Purchase History
| Date | Buyer | Sale Price | Title Company |
|---|---|---|---|
| Lowery Marcus | -- | None Available | |
| Lowery Marcus | -- | -- | |
| Lowery Marcus | $67,816 | -- | |
| Manora Dollie | $41,000 | -- | |
| Hud | -- | -- | |
| Regions Mtg Inc | $52,249 | -- |
Source: Public Records
Mortgage History
| Date | Status | Borrower | Loan Amount |
|---|---|---|---|
| Previous Owner | Lowery Marcus | $66,316 | |
| Previous Owner | Manora Dollie | $41,000 |
Source: Public Records
Tax History Compared to Growth
Tax History
| Year | Tax Paid | Tax Assessment Tax Assessment Total Assessment is a certain percentage of the fair market value that is determined by local assessors to be the total taxable value of land and additions on the property. | Land | Improvement |
|---|---|---|---|---|
| 2025 | $353 | $7,920 | $1,000 | $6,920 |
| 2024 | $378 | $8,430 | $1,000 | $7,430 |
| 2023 | $378 | $7,190 | $1,000 | $6,190 |
| 2022 | $184 | $6,160 | $1,000 | $5,160 |
| 2021 | $135 | $4,820 | $0 | $0 |
| 2020 | $135 | $4,810 | $1,000 | $3,810 |
| 2019 | $135 | $4,810 | $1,000 | $3,810 |
| 2018 | $176 | $4,810 | $1,000 | $3,810 |
| 2017 | $126 | $9,140 | $2,000 | $7,140 |
| 2014 | $128 | $4,640 | $1,000 | $3,640 |
| 2013 | -- | $4,610 | $1,000 | $3,610 |
Source: Public Records
Map
Nearby Homes
- 1348 Marco Rd
- 1384 Devonshire Dr
- 1131 Marlowe Dr
- 1222 E Audubon Rd
- 4225 Sunshine Dr
- 4287 Sussex Dr
- 1712 Marlowe Dr
- 1206 Woodbridge Dr
- 4607 Delray Rd
- 1030 Lynwood Dr
- 712 Buckingham Dr
- 1152 Woodbridge Dr
- 701 Buckingham Dr
- 4314 Nordale Dr
- 742 Queensbury Dr
- 3908 Princeton Rd
- 1249 Seth Johnson Dr
- 1255 Seth Johnson Dr
- 2131 Beverly Dr
- 4804 Regal Dr
- 1318 Buckingham Dr
- 1336 Buckingham Dr
- 1312 Buckingham Dr
- 1327 Marco Rd
- 1321 Marco Rd
- 1333 Marco Rd
- 1325 Buckingham Dr
- 1331 Buckingham Dr
- 1339 Marco Rd
- 1315 Marco Rd
- 1342 Buckingham Dr
- 1306 Buckingham Dr
- 1319 Buckingham Dr
- 1337 Buckingham Dr
- 1345 Marco Rd
- 1309 Marco Rd
- 1313 Buckingham Dr
- 1343 Buckingham Dr
- 1348 Buckingham Dr
- 1307 Buckingham Dr