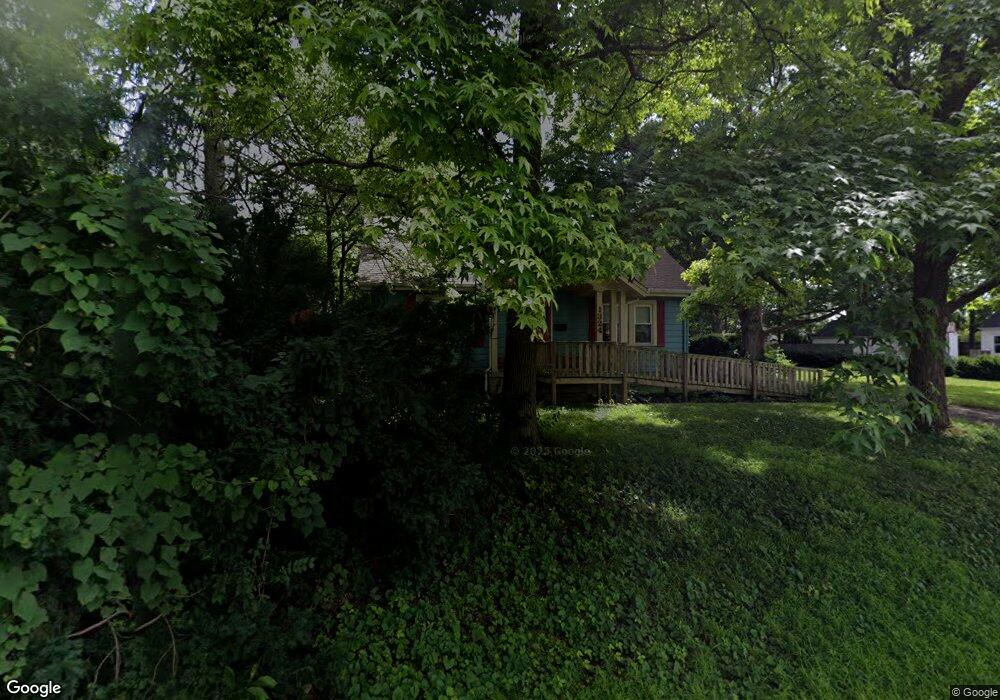
1324 Cloverfield Ave Dayton, OH 45429
Estimated Value: $156,000 - $255,000
3
Beds
1
Bath
952
Sq Ft
$215/Sq Ft
Est. Value
About This Home
This home is located at 1324 Cloverfield Ave, Dayton, OH 45429 and is currently estimated at $204,259, approximately $214 per square foot. 1324 Cloverfield Ave is a home located in Montgomery County with nearby schools including John F. Kennedy Elementary School, Kettering Middle School, and Kettering Fairmont High School.
Ownership History
Date
Name
Owned For
Owner Type
Purchase Details
Closed on
Mar 3, 2021
Sold by
Thomas J Fitzgibbon Inc
Bought by
Lewis Cody Daniel
Current Estimated Value
Home Financials for this Owner
Home Financials are based on the most recent Mortgage that was taken out on this home.
Original Mortgage
$169,750
Outstanding Balance
$152,859
Interest Rate
2.7%
Mortgage Type
New Conventional
Estimated Equity
$56,206
Purchase Details
Closed on
Oct 9, 2020
Sold by
Snapp Rebecca L
Bought by
Thomas J Fitzgibbon Inc
Purchase Details
Closed on
Mar 4, 2010
Sold by
Snapp Donald J
Bought by
Snapp Rebecca L
Purchase Details
Closed on
Feb 18, 2003
Sold by
Snapp Donald J and Snapp Rebecca L
Bought by
Snapp Donald J and Snapp Rebecca L
Home Financials for this Owner
Home Financials are based on the most recent Mortgage that was taken out on this home.
Original Mortgage
$64,000
Interest Rate
6.07%
Create a Home Valuation Report for This Property
The Home Valuation Report is an in-depth analysis detailing your home's value as well as a comparison with similar homes in the area
Home Values in the Area
Average Home Value in this Area
Purchase History
| Date | Buyer | Sale Price | Title Company |
|---|---|---|---|
| Lewis Cody Daniel | $175,000 | Sterling Land Title Agcy Inc | |
| Thomas J Fitzgibbon Inc | $85,100 | None Available | |
| Snapp Rebecca L | -- | Attorney | |
| Snapp Donald J | -- | -- |
Source: Public Records
Mortgage History
| Date | Status | Borrower | Loan Amount |
|---|---|---|---|
| Open | Lewis Cody Daniel | $169,750 | |
| Previous Owner | Snapp Donald J | $64,000 |
Source: Public Records
Tax History Compared to Growth
Tax History
| Year | Tax Paid | Tax Assessment Tax Assessment Total Assessment is a certain percentage of the fair market value that is determined by local assessors to be the total taxable value of land and additions on the property. | Land | Improvement |
|---|---|---|---|---|
| 2024 | $2,927 | $47,100 | $14,880 | $32,220 |
| 2023 | $2,927 | $47,100 | $14,880 | $32,220 |
| 2022 | $2,897 | $36,870 | $11,620 | $25,250 |
| 2021 | $2,680 | $36,870 | $11,620 | $25,250 |
| 2020 | $2,748 | $36,870 | $11,620 | $25,250 |
| 2019 | $2,415 | $29,260 | $10,550 | $18,710 |
| 2018 | $2,428 | $29,260 | $10,550 | $18,710 |
| 2017 | $2,236 | $29,260 | $10,550 | $18,710 |
| 2016 | $2,332 | $28,680 | $10,550 | $18,130 |
| 2015 | $2,228 | $28,680 | $10,550 | $18,130 |
| 2014 | $2,228 | $28,680 | $10,550 | $18,130 |
| 2012 | -- | $30,670 | $10,210 | $20,460 |
Source: Public Records
Map
Nearby Homes
- 1118 Gardner Rd
- 1131 Wenbrook Dr
- 1081 Kenosha Rd
- 1105 Greenridge Dr
- 1040 Kenosha Rd
- 1013 Swango Dr
- 3605 Lisbon St
- 4307 Meadowcroft Rd
- 1721 Willamet Rd
- 4351 Karen Dr
- 3411 Sagamon Ave
- 959 Kimberly Dr
- 3309 Sharon Ave
- 1020 Carlo Dr
- 3525 Valleywood Dr
- 3663 Wenbrook Dr
- 3806 Saranac Dr
- 3201 Beaver Ave
- 3198 Sagamon Ave Unit 13198
- 1113 Devon Ave
- 1328 Cloverfield Ave
- 1316 Cloverfield Ave
- 1333 Wheatland Ave
- 1332 Cloverfield Ave
- 1325 Wheatland Ave
- 1341 Wheatland Ave
- 1317 Wheatland Ave
- 1325 Cloverfield Ave
- 1345 Wheatland Ave
- 1308 Cloverfield Ave
- 1340 Cloverfield Ave
- 1333 Cloverfield Ave
- 1315 Cloverfield Ave
- 1337 Cloverfield Ave
- 1309 Wheatland Ave
- 1344 Cloverfield Ave
- 1304 Cloverfield Ave
- 1353 Wheatland Ave
- 1311 Cloverfield Ave
- 1341 Cloverfield Ave