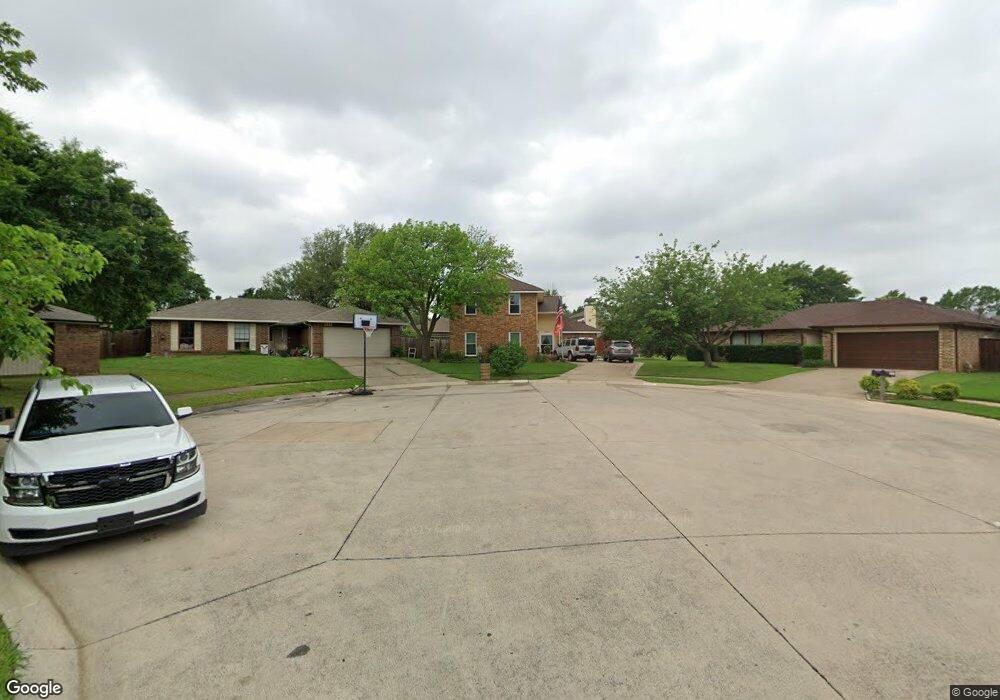
1324 Colony Ct Flower Mound, TX 75028
Prairie Creek NeighborhoodEstimated Value: $380,000 - $395,000
--
Bed
2
Baths
1,808
Sq Ft
$215/Sq Ft
Est. Value
About This Home
This home is located at 1324 Colony Ct, Flower Mound, TX 75028 and is currently estimated at $388,349, approximately $214 per square foot. 1324 Colony Ct is a home located in Denton County with nearby schools including Prairie Trail Elementary School, Lamar Middle School, and Marcus High School.
Ownership History
Date
Name
Owned For
Owner Type
Purchase Details
Closed on
Apr 22, 2017
Sold by
Townsend Dorothy and Townsend Donnie Rue
Bought by
Townsend Dorothy and Townsend Donnie Rue
Current Estimated Value
Home Financials for this Owner
Home Financials are based on the most recent Mortgage that was taken out on this home.
Original Mortgage
$129,700
Outstanding Balance
$101,337
Interest Rate
2.25%
Mortgage Type
VA
Estimated Equity
$287,012
Purchase Details
Closed on
Feb 15, 2007
Sold by
Glenn John D and Glenn Bambi R
Bought by
Townsend Dorothy Jean and Townsend Donnie Rue
Home Financials for this Owner
Home Financials are based on the most recent Mortgage that was taken out on this home.
Original Mortgage
$133,209
Interest Rate
6.17%
Mortgage Type
Purchase Money Mortgage
Purchase Details
Closed on
Jul 18, 2002
Sold by
Florence Michael S
Bought by
Glenn John D and Glenn Bambi R
Home Financials for this Owner
Home Financials are based on the most recent Mortgage that was taken out on this home.
Original Mortgage
$132,000
Interest Rate
6.73%
Create a Home Valuation Report for This Property
The Home Valuation Report is an in-depth analysis detailing your home's value as well as a comparison with similar homes in the area
Home Values in the Area
Average Home Value in this Area
Purchase History
| Date | Buyer | Sale Price | Title Company |
|---|---|---|---|
| Townsend Dorothy | -- | None Available | |
| Townsend Dorothy Jean | -- | Freedom Title | |
| Glenn John D | -- | -- |
Source: Public Records
Mortgage History
| Date | Status | Borrower | Loan Amount |
|---|---|---|---|
| Open | Townsend Dorothy | $129,700 | |
| Closed | Townsend Dorothy Jean | $133,209 | |
| Previous Owner | Glenn John D | $132,000 |
Source: Public Records
Tax History Compared to Growth
Tax History
| Year | Tax Paid | Tax Assessment Tax Assessment Total Assessment is a certain percentage of the fair market value that is determined by local assessors to be the total taxable value of land and additions on the property. | Land | Improvement |
|---|---|---|---|---|
| 2025 | -- | $349,153 | $86,800 | $312,226 |
| 2024 | $5,374 | $317,412 | $0 | $0 |
| 2023 | $4,925 | $288,556 | $86,800 | $309,100 |
| 2022 | $4,805 | $258,407 | $72,850 | $204,627 |
| 2021 | $4,719 | $234,915 | $49,600 | $185,315 |
| 2020 | $4,615 | $230,837 | $49,600 | $181,237 |
| 2019 | $4,720 | $227,801 | $49,600 | $178,201 |
| 2018 | $4,446 | $213,324 | $49,600 | $165,138 |
| 2017 | $4,087 | $193,931 | $49,600 | $144,331 |
| 2016 | $3,825 | $181,490 | $49,600 | $138,859 |
| 2015 | -- | $164,991 | $33,670 | $131,321 |
| 2013 | -- | $146,057 | $33,670 | $112,387 |
Source: Public Records
Map
Nearby Homes
- 5329 Ponder Place
- 5400 Carriage Ct
- 1208 Homestead St
- 5309 Buckner Dr
- 1105 Coker Dr
- 1617 Oak Creek Dr
- 4925 Marcus Dr
- 1682 Shannon Dr
- 1554 N Valley Pkwy
- 1204 Marcus Ct
- 1661 Crosshaven Dr
- 1602 Autumn Breeze Ln
- 5324 Peterson Ct
- 1613 Autumn Breeze Ln
- 1601 Autumn Breeze Ln
- 1534 Autumn Breeze Ln
- 1581 Glenmore Dr
- 5508 Frost Ln
- 1529 Springaire Ln
- 1685 Niagara Blvd
- 1320 Colony Ct
- 1321 Colony Ct
- 5208 Colonial Dr
- 5212 Colonial Dr
- 1316 Colony Ct
- 5204 Colonial Dr
- 5216 Colonial Dr
- 1319 Colony Ct
- 1325 Ponder Way
- 1312 Colony Ct
- 1313 Colony Ct
- 1317 Ponder Way
- 5220 Colonial Dr
- 1324 Homestead St
- 1320 Homestead St
- 1328 Homestead St
- 1316 Homestead St
- 1308 Colony Ct
- 1313 Ponder Way
- 1309 Colony Ct