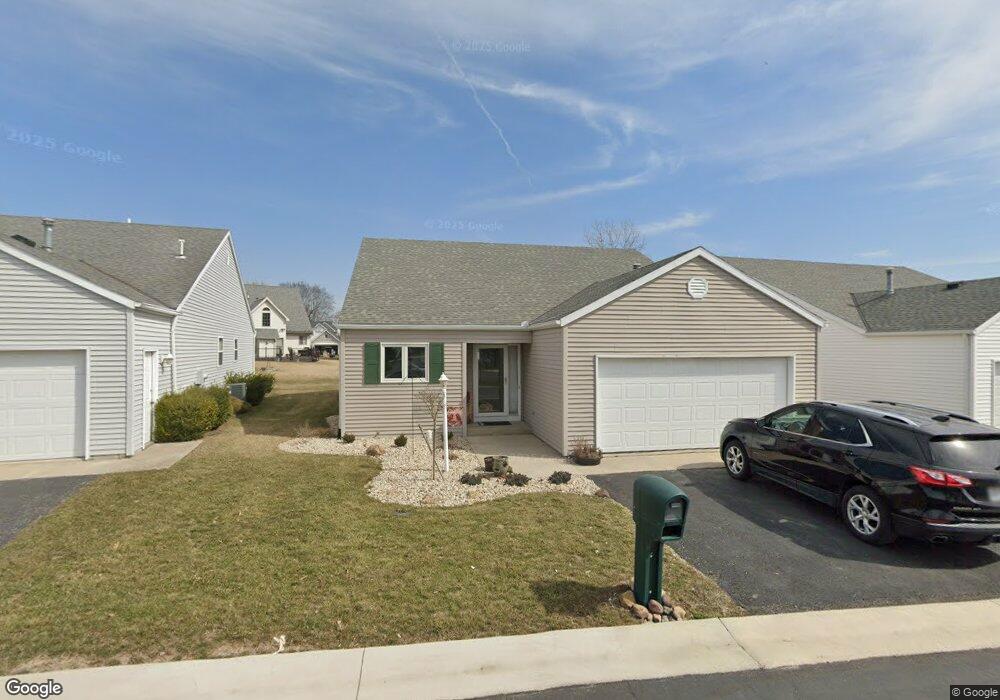
1324 Countryside Dr Unit B13 Findlay, OH 45840
Estimated Value: $218,380 - $256,000
2
Beds
2
Baths
1,220
Sq Ft
$190/Sq Ft
Est. Value
About This Home
This home is located at 1324 Countryside Dr Unit B13, Findlay, OH 45840 and is currently estimated at $232,095, approximately $190 per square foot. 1324 Countryside Dr Unit B13 is a home located in Hancock County with nearby schools including Wilson Vance Elementary School, Whittier Elementary School, and Glenwood Middle School.
Ownership History
Date
Name
Owned For
Owner Type
Purchase Details
Closed on
Aug 31, 2004
Sold by
The Fifth Third Bank Northwester Ohio Na
Bought by
Miceli Michele
Current Estimated Value
Home Financials for this Owner
Home Financials are based on the most recent Mortgage that was taken out on this home.
Original Mortgage
$102,000
Outstanding Balance
$42,381
Interest Rate
3.5%
Mortgage Type
Purchase Money Mortgage
Estimated Equity
$189,714
Purchase Details
Closed on
Sep 25, 1997
Sold by
Mesick Sarah
Bought by
Fifth Third Bank Trustee
Purchase Details
Closed on
Dec 4, 1996
Sold by
Petti Construction
Bought by
Drake William and Drake Mary Lou
Purchase Details
Closed on
Jun 10, 1996
Sold by
Petti Const
Bought by
Mesick Sarah J
Home Financials for this Owner
Home Financials are based on the most recent Mortgage that was taken out on this home.
Original Mortgage
$89,750
Interest Rate
7.97%
Mortgage Type
New Conventional
Create a Home Valuation Report for This Property
The Home Valuation Report is an in-depth analysis detailing your home's value as well as a comparison with similar homes in the area
Home Values in the Area
Average Home Value in this Area
Purchase History
| Date | Buyer | Sale Price | Title Company |
|---|---|---|---|
| Miceli Michele | $127,500 | -- | |
| Fifth Third Bank Trustee | $116,500 | -- | |
| Drake William | $106,000 | -- | |
| Mesick Sarah J | $99,750 | -- |
Source: Public Records
Mortgage History
| Date | Status | Borrower | Loan Amount |
|---|---|---|---|
| Open | Miceli Michele | $102,000 | |
| Previous Owner | Mesick Sarah J | $89,750 |
Source: Public Records
Tax History Compared to Growth
Tax History
| Year | Tax Paid | Tax Assessment Tax Assessment Total Assessment is a certain percentage of the fair market value that is determined by local assessors to be the total taxable value of land and additions on the property. | Land | Improvement |
|---|---|---|---|---|
| 2024 | $1,637 | $55,880 | $2,800 | $53,080 |
| 2023 | $1,662 | $55,880 | $2,800 | $53,080 |
| 2022 | $1,671 | $55,880 | $2,800 | $53,080 |
| 2021 | $1,569 | $47,310 | $2,100 | $45,210 |
| 2020 | $1,569 | $47,310 | $2,100 | $45,210 |
| 2019 | $1,538 | $47,310 | $2,100 | $45,210 |
| 2018 | $1,419 | $41,410 | $2,100 | $39,310 |
| 2017 | $1,443 | $41,930 | $2,100 | $39,830 |
| 2016 | $1,428 | $41,930 | $2,100 | $39,830 |
| 2015 | $1,312 | $38,750 | $2,100 | $36,650 |
| 2014 | $1,312 | $38,750 | $2,100 | $36,650 |
| 2012 | $1,587 | $36,030 | $2,100 | $33,930 |
Source: Public Records
Map
Nearby Homes
- 1450 Fostoria Ave
- 3 Ohio 12
- 0 Ohio 12
- 1 Ohio 12
- 4 Ohio 12
- 2 Ohio 12
- 1216 Concord Ct
- 1018 Cherry Ln
- 1641 Cherry Ln
- 1736 Woodridge Crescent
- 1062 Vincent St
- 1474 Southwood Ave
- 716 Winfield Ave
- 1010 Brenda Ct
- 0 Romick Pkwy Unit 6131435
- 0 Romick Pkwy Unit 6123797
- 0 Romick Pkwy Unit 20244553
- 1865 Breckenridge Rd
- 1928 Deer Ridge Dr
- 1928 Deer Ridge Dr Unit L-133
- 1328 Countryside Dr
- 1320 Countryside Dr
- 1316 Countryside Dr
- 1315 Countryside Dr
- 1329 Countryside Dr
- 1334 Countryside Dr
- 1332 Countryside Dr
- 1301 Countryside Dr
- 1420 Plum Creek Dr
- 1308 Countryside Dr
- 1308 Countryside Dr Unit B9
- 1331 Countryside Dr
- 1304 Countryside Dr
- 1428 Plum Creek Dr
- 1335 Countryside Dr
- 1416 Plum Creek Dr
- 1336 Countryside Dr
- 1424 Plum Creek Dr
- 1300 Countryside Dr
- 1249 Countryside Dr Unit B5