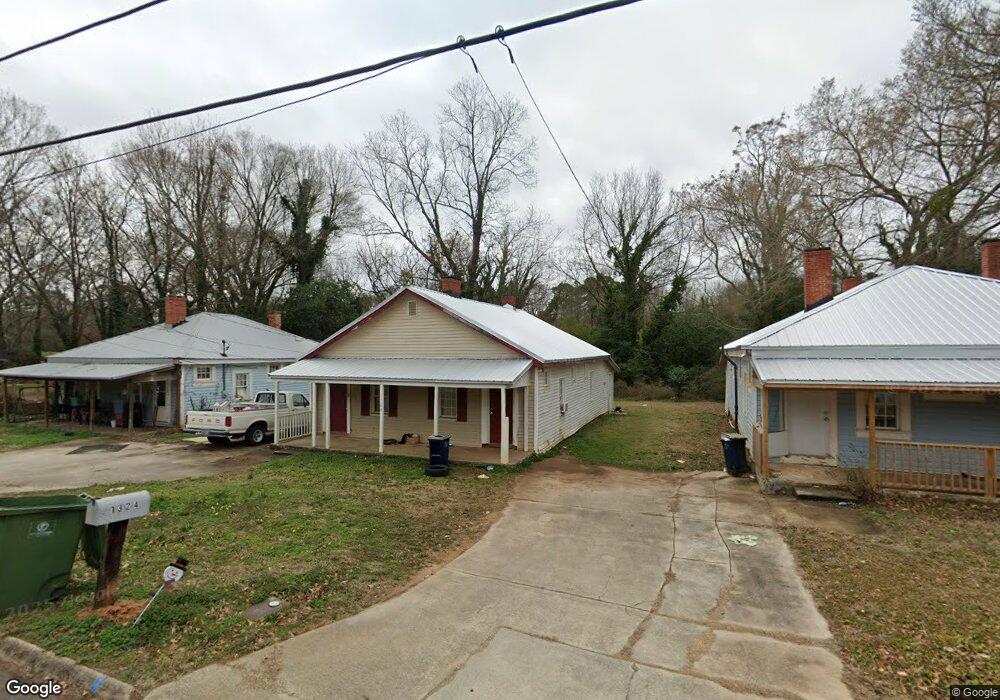
1324 D F Fuller Dr Griffin, GA 30224
Spalding County NeighborhoodEstimated Value: $103,038 - $154,000
2
Beds
2
Baths
1,020
Sq Ft
$124/Sq Ft
Est. Value
About This Home
This home is located at 1324 D F Fuller Dr, Griffin, GA 30224 and is currently estimated at $126,010, approximately $123 per square foot. 1324 D F Fuller Dr is a home located in Spalding County with nearby schools including Anne Street Elementary School, Rehoboth Road Middle School, and Griffin High School.
Ownership History
Date
Name
Owned For
Owner Type
Purchase Details
Closed on
Apr 19, 2013
Sold by
Duffy Moon Properties Llc
Bought by
Crumbley Jodie
Current Estimated Value
Purchase Details
Closed on
Jan 12, 2001
Sold by
Olson Edna H
Bought by
Hinton Charles
Home Financials for this Owner
Home Financials are based on the most recent Mortgage that was taken out on this home.
Original Mortgage
$37,450
Interest Rate
7.09%
Mortgage Type
New Conventional
Purchase Details
Closed on
Aug 4, 1980
Sold by
Goldstein Louis W
Bought by
Olson Edna H
Purchase Details
Closed on
Sep 16, 1974
Sold by
Goldstein Louis F
Bought by
Goldstein Louis W
Purchase Details
Closed on
Jan 1, 1974
Sold by
Goldstein Louis W
Bought by
Goldstein Louis F
Purchase Details
Closed on
Nov 7, 1973
Sold by
Newton Will Hill
Bought by
Goldstein Louis W
Purchase Details
Closed on
Jan 1, 1950
Bought by
Newton Will Hill
Create a Home Valuation Report for This Property
The Home Valuation Report is an in-depth analysis detailing your home's value as well as a comparison with similar homes in the area
Home Values in the Area
Average Home Value in this Area
Purchase History
| Date | Buyer | Sale Price | Title Company |
|---|---|---|---|
| Crumbley Jodie | -- | -- | |
| Hinton Charles | $28,000 | -- | |
| Olson Edna H | $52,600 | -- | |
| Goldstein Louis W | -- | -- | |
| Goldstein Louis F | -- | -- | |
| Goldstein Louis W | $80,200 | -- | |
| Newton Will Hill | -- | -- |
Source: Public Records
Mortgage History
| Date | Status | Borrower | Loan Amount |
|---|---|---|---|
| Previous Owner | Hinton Charles | $37,450 |
Source: Public Records
Tax History Compared to Growth
Tax History
| Year | Tax Paid | Tax Assessment Tax Assessment Total Assessment is a certain percentage of the fair market value that is determined by local assessors to be the total taxable value of land and additions on the property. | Land | Improvement |
|---|---|---|---|---|
| 2024 | $691 | $18,106 | $3,200 | $14,906 |
| 2023 | $691 | $17,743 | $3,200 | $14,543 |
| 2022 | $537 | $13,426 | $2,000 | $11,426 |
| 2021 | $497 | $12,442 | $2,000 | $10,442 |
| 2020 | $426 | $10,652 | $1,254 | $9,398 |
| 2019 | $433 | $10,652 | $1,254 | $9,398 |
| 2018 | $418 | $9,906 | $1,254 | $8,652 |
| 2017 | $409 | $9,906 | $1,254 | $8,652 |
| 2016 | $416 | $9,906 | $1,254 | $8,652 |
| 2015 | $423 | $9,906 | $1,254 | $8,652 |
| 2014 | $436 | $9,906 | $1,254 | $8,652 |
Source: Public Records
Map
Nearby Homes
- 1313 D F Fuller Dr
- 1228-1328 Edgewood Ave
- 1264 Cherokee Ave
- 309 Cherokee Cir
- 305 S 18th St
- 1054 W College Street Extension
- 1326 Oakdale Dr
- 1012 W College Extension
- 1022 Beck St
- 820 Pamela Dr
- 141 North Expy
- 825 Pamela Dr
- 915 W Poplar St
- 717 Scales St
- 731 Scales St
- 203 Hillside Cir
- 754 Scales St
- 1223 W Broad St
- 1206 Hillwood Ave
- 811 Westbrook St
- 1330 D F Fuller Dr
- 1320 D F Fuller Dr
- 1332 D F Fuller Dr
- 1316 D F Fuller Dr
- 1312 D F Fuller Dr
- 1336 D F Fuller Dr
- 1325 Edgewood Ave
- 1329 Edgewood Ave
- 1321 Edgewood Ave
- 1308 D F Fuller Dr
- 1333 Edgewood Ave
- 1319 Edgewood Ave
- 1340 D F Fuller Dr
- 1339 Edgewood Ave
- 1315 Edgewood Ave
- 1344 D F Fuller Dr
- 1329 D F Fuller Dr
- 1329 D F Fuller Dr Unit A
- 1321 D F Fuller Dr
- 1307 Edgewood Ave