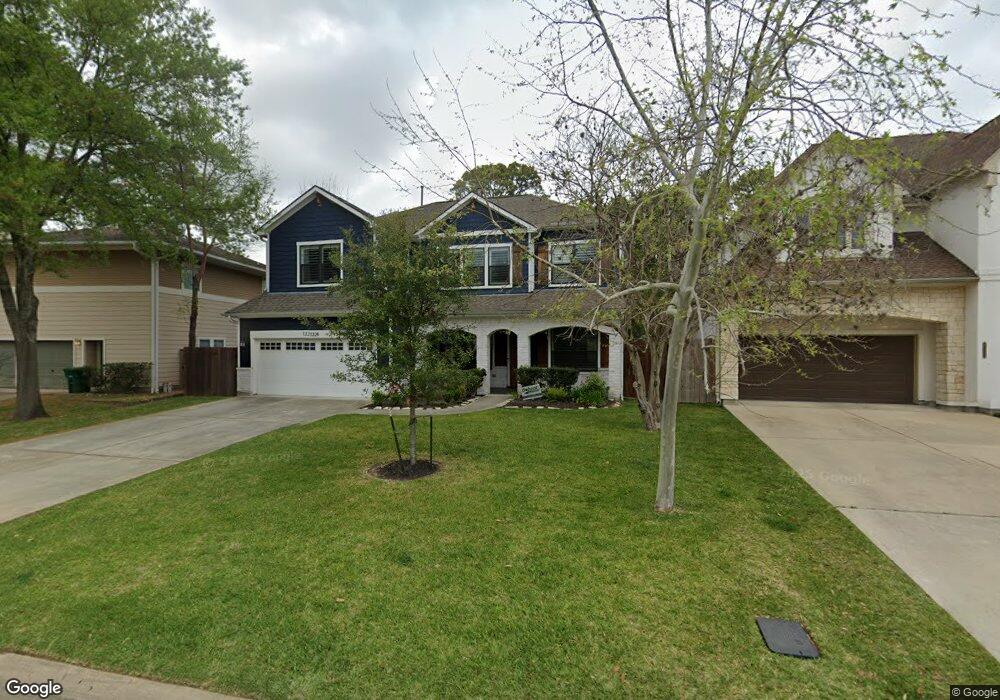
1324 Du Barry Ln Houston, TX 77018
Oak Forest-Garden Oaks NeighborhoodEstimated Value: $928,000 - $1,176,644
4
Beds
4
Baths
3,077
Sq Ft
$350/Sq Ft
Est. Value
About This Home
This home is located at 1324 Du Barry Ln, Houston, TX 77018 and is currently estimated at $1,077,411, approximately $350 per square foot. 1324 Du Barry Ln is a home located in Harris County with nearby schools including Oak Forest Elementary School, Frank Black Middle School, and Waltrip High School.
Ownership History
Date
Name
Owned For
Owner Type
Purchase Details
Closed on
Apr 28, 2017
Sold by
Kar Capital Enterprises Inc
Bought by
Cross Tine Toft and Cross Cameron John
Current Estimated Value
Home Financials for this Owner
Home Financials are based on the most recent Mortgage that was taken out on this home.
Original Mortgage
$574,240
Outstanding Balance
$480,147
Interest Rate
4.3%
Mortgage Type
New Conventional
Estimated Equity
$597,264
Purchase Details
Closed on
Sep 30, 2016
Sold by
Smith Terry
Bought by
Kar Capital Enterprises Inc
Purchase Details
Closed on
Jul 30, 1999
Sold by
Littlepage Dixie S
Bought by
Smith Terry
Home Financials for this Owner
Home Financials are based on the most recent Mortgage that was taken out on this home.
Original Mortgage
$67,900
Interest Rate
7.63%
Create a Home Valuation Report for This Property
The Home Valuation Report is an in-depth analysis detailing your home's value as well as a comparison with similar homes in the area
Home Values in the Area
Average Home Value in this Area
Purchase History
| Date | Buyer | Sale Price | Title Company |
|---|---|---|---|
| Cross Tine Toft | -- | Chicago Title | |
| Kar Capital Enterprises Inc | -- | Chicago Title Co | |
| Smith Terry | -- | Alamo Title 24 |
Source: Public Records
Mortgage History
| Date | Status | Borrower | Loan Amount |
|---|---|---|---|
| Open | Cross Tine Toft | $574,240 | |
| Previous Owner | Smith Terry | $67,900 |
Source: Public Records
Tax History Compared to Growth
Tax History
| Year | Tax Paid | Tax Assessment Tax Assessment Total Assessment is a certain percentage of the fair market value that is determined by local assessors to be the total taxable value of land and additions on the property. | Land | Improvement |
|---|---|---|---|---|
| 2025 | $16,780 | $1,028,335 | $473,970 | $554,365 |
| 2024 | $16,780 | $1,052,495 | $473,970 | $578,525 |
| 2023 | $16,780 | $1,018,800 | $473,970 | $544,830 |
| 2022 | $19,967 | $906,825 | $396,270 | $510,555 |
| 2021 | $18,111 | $777,074 | $380,730 | $396,344 |
| 2020 | $18,803 | $776,492 | $326,340 | $450,152 |
| 2019 | $18,271 | $722,041 | $326,340 | $395,701 |
| 2018 | $18,953 | $749,000 | $310,800 | $438,200 |
| 2017 | $14,897 | $589,131 | $310,800 | $278,331 |
| 2016 | $5,219 | $316,418 | $310,800 | $5,618 |
| 2015 | $3,347 | $315,000 | $310,800 | $4,200 |
| 2014 | $3,347 | $258,640 | $248,640 | $10,000 |
Source: Public Records
Map
Nearby Homes
- 1339 Du Barry Ln
- 1261 Du Barry Ln
- 1249 Chippendale Rd
- 2006 Lou Ellen Ln Unit H
- 3506 Oak Forest Dr
- 1261 Wakefield Dr
- 1226 Du Barry Ln
- 2116 Oatfield Dr
- 1226 Chippendale Rd
- 2122 Oatfield Dr
- 1403 Wakefield Dr
- 3527 Ella Blvd
- 1148 Du Barry Ln
- 1526 Du Barry Ln
- 3720 Ella Blvd
- 1237 Althea Dr
- 1316 Althea Dr
- 1225 Althea Dr
- 2206 Lou Ellen Ln Unit C
- 1438 Wakefield Dr
- 1320 Du Barry Ln
- 1328 Du Barry Ln
- 1330 Ebony Ln
- 1316 Du Barry Ln
- 1332 Ebony Ln
- 1312 Du Barry Ln
- 1323 Du Barry Ln
- 1319 Du Barry Ln
- 1327 Du Barry Ln
- 1340 Du Barry Ln
- 1336 Ebony Ln
- 1315 Du Barry Ln
- 1331 Du Barry Ln
- 1323 Woodcrest Dr
- 1319 Woodcrest Dr
- 1315 Woodcrest Dr
- 1327 Woodcrest Dr
- 1311 Woodcrest Dr
- 1311 Du Barry Ln
- 1331 Woodcrest Dr