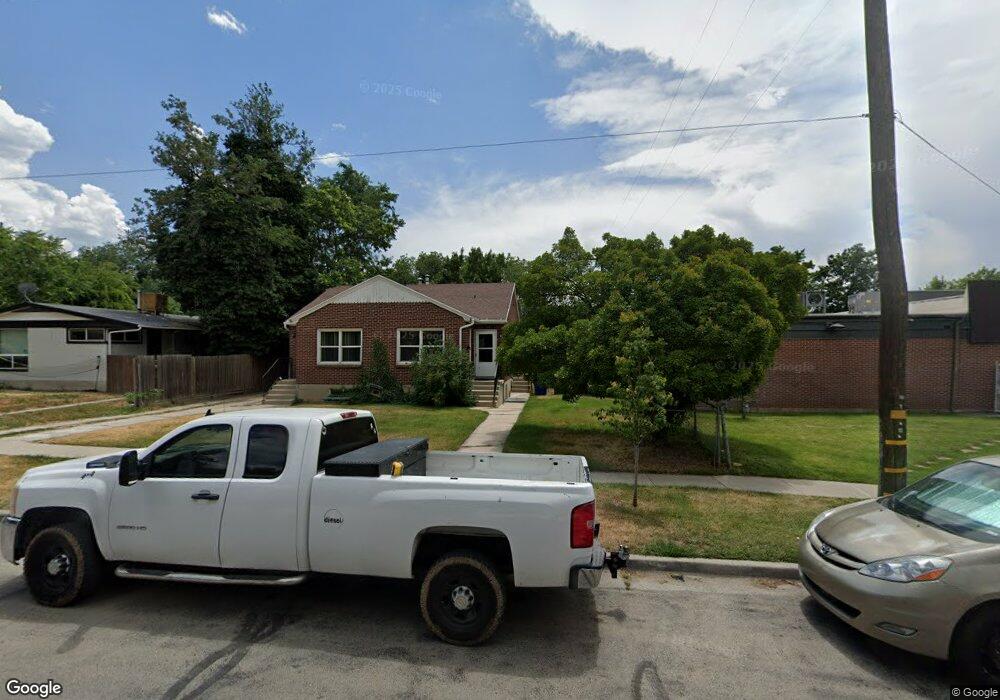
1324 E Zenith Ave Salt Lake City, UT 84106
Sugar House NeighborhoodEstimated Value: $679,000 - $812,000
4
Beds
3
Baths
2,396
Sq Ft
$304/Sq Ft
Est. Value
About This Home
This home is located at 1324 E Zenith Ave, Salt Lake City, UT 84106 and is currently estimated at $727,422, approximately $303 per square foot. 1324 E Zenith Ave is a home located in Salt Lake County with nearby schools including Highland Park Elementary School, Hillside Middle School, and Highland High School.
Ownership History
Date
Name
Owned For
Owner Type
Purchase Details
Closed on
Aug 9, 2005
Sold by
Cardenas Jaime and Cardenas Kerri
Bought by
Robinson Colin G and Robinson Jeanetta P
Current Estimated Value
Home Financials for this Owner
Home Financials are based on the most recent Mortgage that was taken out on this home.
Original Mortgage
$192,000
Interest Rate
5.18%
Mortgage Type
Fannie Mae Freddie Mac
Purchase Details
Closed on
Sep 30, 2004
Sold by
Mickelson John E
Bought by
Cardenas Jaime and Cardenas Kerri
Purchase Details
Closed on
Oct 31, 1997
Sold by
Dewey Paul
Bought by
Harris Jody L and Hamilton Judy L
Purchase Details
Closed on
Oct 23, 1997
Sold by
Birrell Fontella
Bought by
Harris Jody L and Hamilton Judy L
Purchase Details
Closed on
Apr 4, 1994
Sold by
Leyshon Helen
Bought by
Harris Jody L and Hamilton Judy L
Create a Home Valuation Report for This Property
The Home Valuation Report is an in-depth analysis detailing your home's value as well as a comparison with similar homes in the area
Home Values in the Area
Average Home Value in this Area
Purchase History
| Date | Buyer | Sale Price | Title Company |
|---|---|---|---|
| Robinson Colin G | -- | Sundance Title | |
| Cardenas Jaime | -- | Equity Title | |
| Cardenas Jaime | -- | Equity Title | |
| Harris Jody L | -- | Associated Title | |
| Harris Jody L | -- | Associated Title | |
| Harris Jody L | -- | Associated Title |
Source: Public Records
Mortgage History
| Date | Status | Borrower | Loan Amount |
|---|---|---|---|
| Closed | Robinson Colin G | $192,000 |
Source: Public Records
Tax History Compared to Growth
Tax History
| Year | Tax Paid | Tax Assessment Tax Assessment Total Assessment is a certain percentage of the fair market value that is determined by local assessors to be the total taxable value of land and additions on the property. | Land | Improvement |
|---|---|---|---|---|
| 2025 | $2,962 | $585,300 | $209,900 | $375,400 |
| 2024 | $2,962 | $565,200 | $203,400 | $361,800 |
| 2023 | $2,780 | $511,200 | $168,100 | $343,100 |
| 2022 | $3,012 | $519,800 | $164,800 | $355,000 |
| 2021 | $3,327 | $426,700 | $126,800 | $299,900 |
| 2020 | $2,638 | $392,300 | $116,200 | $276,100 |
| 2019 | $2,455 | $343,500 | $109,000 | $234,500 |
| 2018 | $2,283 | $311,000 | $109,000 | $202,000 |
| 2017 | $2,343 | $299,100 | $109,000 | $190,100 |
| 2016 | $2,158 | $261,600 | $109,000 | $152,600 |
| 2015 | $2,224 | $255,500 | $114,400 | $141,100 |
| 2014 | $2,133 | $243,100 | $112,200 | $130,900 |
Source: Public Records
Map
Nearby Homes
- 1371 E Zenith Ave
- 1314 E Crandall Ave
- 2865 S 1335 E
- 3026 S Crescent Dr
- 2970 S Richmond St
- 2760 S Highland Dr Unit 21
- 1582 E Zenith Ave
- 1152 E 2700 S Unit S148
- 2710 S Highland Dr Unit 11
- 1192 E 2700 S
- 1411 Woodland Ave
- 1190 E 2700 S Unit A4
- 1190 E 2700 S Unit A1
- 1150 E 2700 S Unit 50G
- 1150 E 2700 S Unit G51
- 1436 E Woodland Ave
- 1130 E 2700 S Unit K83
- 1056 E Elgin Ave
- 2795 S Imperial St
- 2618 S 1100 E
- 1324 Zenith Ave
- 1332 Zenith Ave
- 1332 E Zenith Ave
- 1338 Zenith Ave
- 1338 E Zenith Ave
- 1329 E Hudson Ave
- 1329 Hudson Ave
- 1350 Zenith Ave
- 1335 Hudson Ave
- 1350 E Zenith Ave
- 1335 E Hudson Ave
- 1331 E Zenith Ave
- 1325 Zenith Ave
- 1325 E Zenith Ave
- 1333 Zenith Ave
- 1333 E Zenith Ave
- 1347 Hudson Ave
- 1347 E Hudson Ave
- 1354 E Zenith Ave
- 1341 Zenith Ave