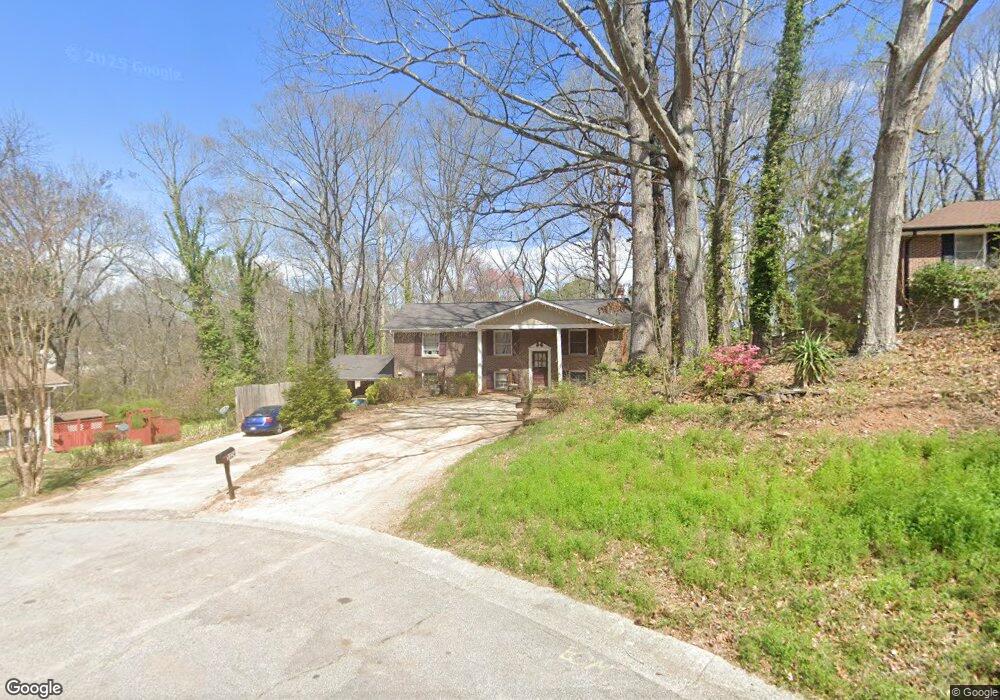
1324 John Robert Dr Unit 17 Morrow, GA 30260
Estimated Value: $234,987 - $306,000
4
Beds
3
Baths
2,430
Sq Ft
$114/Sq Ft
Est. Value
About This Home
This home is located at 1324 John Robert Dr Unit 17, Morrow, GA 30260 and is currently estimated at $277,747, approximately $114 per square foot. 1324 John Robert Dr Unit 17 is a home located in Clayton County with nearby schools including Morrow Elementary School, Babb Middle School, and Charles R. Drew High School.
Ownership History
Date
Name
Owned For
Owner Type
Purchase Details
Closed on
Dec 9, 2014
Sold by
Nguyen Hong V
Bought by
Martinez Jorge L
Current Estimated Value
Home Financials for this Owner
Home Financials are based on the most recent Mortgage that was taken out on this home.
Original Mortgage
$95,733
Outstanding Balance
$74,867
Interest Rate
4.5%
Mortgage Type
FHA
Estimated Equity
$202,880
Purchase Details
Closed on
Dec 12, 2013
Sold by
Hill Douglas
Bought by
Nguyen Hong
Purchase Details
Closed on
Jul 25, 2007
Sold by
Hill Douglas
Bought by
Hill Douglas and Hill Edna P
Purchase Details
Closed on
Oct 24, 1997
Sold by
Buckner Annie R and Buckner Marilyn
Bought by
Hill Douglas H and Hill Edna P
Home Financials for this Owner
Home Financials are based on the most recent Mortgage that was taken out on this home.
Original Mortgage
$103,600
Interest Rate
7.31%
Mortgage Type
New Conventional
Create a Home Valuation Report for This Property
The Home Valuation Report is an in-depth analysis detailing your home's value as well as a comparison with similar homes in the area
Home Values in the Area
Average Home Value in this Area
Purchase History
| Date | Buyer | Sale Price | Title Company |
|---|---|---|---|
| Martinez Jorge L | $97,500 | -- | |
| Nguyen Hong | $71,500 | -- | |
| Hill Douglas | -- | -- | |
| Hill Douglas H | $105,000 | -- |
Source: Public Records
Mortgage History
| Date | Status | Borrower | Loan Amount |
|---|---|---|---|
| Open | Martinez Jorge L | $95,733 | |
| Previous Owner | Hill Douglas H | $103,600 |
Source: Public Records
Tax History Compared to Growth
Tax History
| Year | Tax Paid | Tax Assessment Tax Assessment Total Assessment is a certain percentage of the fair market value that is determined by local assessors to be the total taxable value of land and additions on the property. | Land | Improvement |
|---|---|---|---|---|
| 2024 | $2,011 | $67,680 | $4,800 | $62,880 |
| 2023 | $2,713 | $68,720 | $4,800 | $63,920 |
| 2022 | $2,048 | $67,520 | $4,800 | $62,720 |
| 2021 | $1,564 | $55,000 | $4,800 | $50,200 |
| 2020 | $1,339 | $48,167 | $4,800 | $43,367 |
| 2019 | $1,348 | $47,875 | $4,400 | $43,475 |
| 2018 | $1,358 | $48,156 | $4,400 | $43,756 |
| 2017 | $919 | $35,753 | $4,400 | $31,353 |
| 2016 | $921 | $35,797 | $4,400 | $31,397 |
| 2015 | $1,269 | $0 | $0 | $0 |
| 2014 | $995 | $28,600 | $4,400 | $24,200 |
Source: Public Records
Map
Nearby Homes
- 1331 Woodstone Trace
- 1337 Woodstone Trace
- 1329 Woodstone Trace
- 6433 Stone Way
- 6427 Stone Way Unit O10
- 6437 Stone Way Unit O5
- 6433 Stone Terrace
- 6429 Woodstone Way
- 1394 Wood Cir S
- 1217 Dove Ct
- 6155 Navaho Trail
- 6411 Northridge Dr Unit 6411
- 6430 Oakleaf Way
- 6446 Oakleaf Way
- 6178 Graceland Cir
- 1025 Lynwood Place
- 1324 John Robert Dr
- 1332 John Robert Dr
- 1318 John Robert Dr
- 1317 John Robert Dr
- 1342 John Robert Dr
- 1331 John Robert Dr
- 1359 Hammack Dr
- 1341 John Robert Dr
- 1352 John Robert Dr
- 1327 Woodstone Trace Unit L6
- 1337 Woodstone Trc
- 1333 Woodstone Trace
- 1327 Woodstone Trace
- 1325 Woodstone Trace Unit 7
- 1335 Woodstone Trace
- 1337 Woodstone Trace
- 1360 John Robert Dr
- 1373 Hammack Dr
- 1359 John Robert Dr
- 6435 Stone Terrace Unit K1