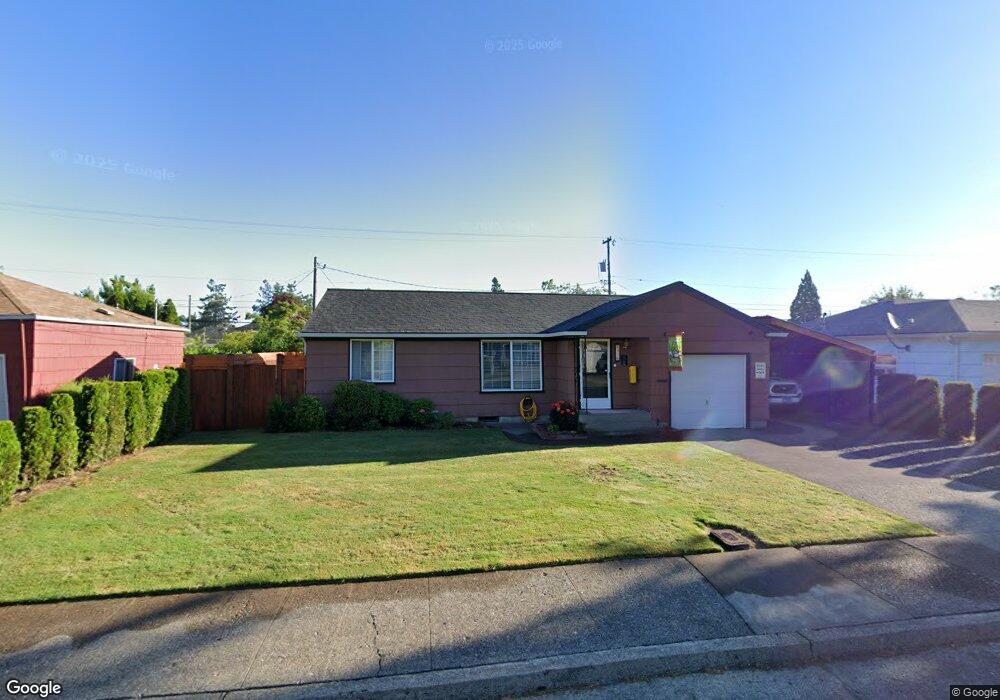
1324 Modoc St Springfield, OR 97477
Midtown South Springfield NeighborhoodEstimated Value: $304,000 - $336,000
2
Beds
1
Bath
880
Sq Ft
$363/Sq Ft
Est. Value
About This Home
This home is located at 1324 Modoc St, Springfield, OR 97477 and is currently estimated at $319,474, approximately $363 per square foot. 1324 Modoc St is a home located in Lane County with nearby schools including Two Rivers Dos Rios Elementary School, Hamlin Middle School, and Springfield High School.
Ownership History
Date
Name
Owned For
Owner Type
Purchase Details
Closed on
Jun 26, 2002
Sold by
Galindo Ben
Bought by
Hunter Patricia S
Current Estimated Value
Home Financials for this Owner
Home Financials are based on the most recent Mortgage that was taken out on this home.
Original Mortgage
$59,850
Outstanding Balance
$25,148
Interest Rate
6.86%
Estimated Equity
$294,326
Purchase Details
Closed on
Oct 22, 2001
Sold by
Galindo Ben
Bought by
Galindo Ben
Create a Home Valuation Report for This Property
The Home Valuation Report is an in-depth analysis detailing your home's value as well as a comparison with similar homes in the area
Home Values in the Area
Average Home Value in this Area
Purchase History
| Date | Buyer | Sale Price | Title Company |
|---|---|---|---|
| Hunter Patricia S | $63,000 | Western Title & Escrow Compa | |
| Galindo Ben | -- | -- |
Source: Public Records
Mortgage History
| Date | Status | Borrower | Loan Amount |
|---|---|---|---|
| Open | Hunter Patricia S | $59,850 |
Source: Public Records
Tax History
| Year | Tax Paid | Tax Assessment Tax Assessment Total Assessment is a certain percentage of the fair market value that is determined by local assessors to be the total taxable value of land and additions on the property. | Land | Improvement |
|---|---|---|---|---|
| 2025 | $2,425 | $132,256 | -- | -- |
| 2024 | $2,386 | $128,404 | -- | -- |
| 2023 | $2,386 | $124,665 | $0 | $0 |
| 2022 | $2,210 | $121,034 | $0 | $0 |
| 2021 | $2,170 | $117,509 | $0 | $0 |
| 2020 | $2,107 | $114,087 | $0 | $0 |
| 2019 | $2,043 | $110,765 | $0 | $0 |
| 2018 | $1,926 | $104,407 | $0 | $0 |
| 2017 | $1,852 | $104,407 | $0 | $0 |
| 2016 | $1,813 | $101,366 | $0 | $0 |
| 2015 | $1,762 | $98,414 | $0 | $0 |
| 2014 | $1,735 | $95,548 | $0 | $0 |
Source: Public Records
Map
Nearby Homes
Your Personal Tour Guide
Ask me questions while you tour the home.