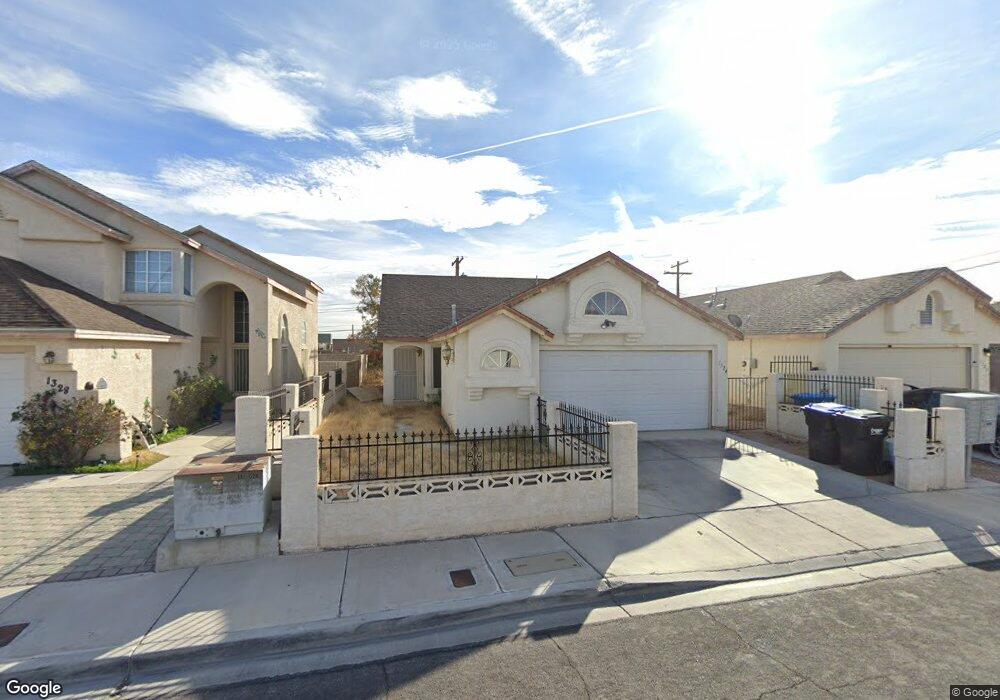
1324 Nye St Las Vegas, NV 89106
West Las Vegas NeighborhoodEstimated Value: $318,465 - $344,000
3
Beds
2
Baths
1,135
Sq Ft
$292/Sq Ft
Est. Value
About This Home
This home is located at 1324 Nye St, Las Vegas, NV 89106 and is currently estimated at $330,866, approximately $291 per square foot. 1324 Nye St is a home located in Clark County with nearby schools including Wendell P. Williams Elementary School, West Prepatory Academy At Charlles I West Hall Sec, and Western High School.
Ownership History
Date
Name
Owned For
Owner Type
Purchase Details
Closed on
Feb 23, 2006
Sold by
Lacy Perry L and Parker Audrei C
Bought by
Lacy Perry L
Current Estimated Value
Home Financials for this Owner
Home Financials are based on the most recent Mortgage that was taken out on this home.
Original Mortgage
$169,600
Outstanding Balance
$108,173
Interest Rate
8.55%
Mortgage Type
Unknown
Estimated Equity
$222,693
Purchase Details
Closed on
Oct 3, 2002
Sold by
Lambert James F and Lambert Barbara J
Bought by
Lacy Perry L and Parker Andrei C
Home Financials for this Owner
Home Financials are based on the most recent Mortgage that was taken out on this home.
Original Mortgage
$113,952
Interest Rate
5.99%
Mortgage Type
FHA
Purchase Details
Closed on
Feb 13, 1996
Sold by
Lambert James E and Lambert Barbara J
Bought by
Lambert James E and Lambert Barbara J
Home Financials for this Owner
Home Financials are based on the most recent Mortgage that was taken out on this home.
Original Mortgage
$10,000
Interest Rate
6.99%
Create a Home Valuation Report for This Property
The Home Valuation Report is an in-depth analysis detailing your home's value as well as a comparison with similar homes in the area
Home Values in the Area
Average Home Value in this Area
Purchase History
| Date | Buyer | Sale Price | Title Company |
|---|---|---|---|
| Lacy Perry L | -- | Land Title Of Nevada | |
| Lacy Perry L | $115,000 | Fidelity National Title | |
| Lambert James E | -- | United Title |
Source: Public Records
Mortgage History
| Date | Status | Borrower | Loan Amount |
|---|---|---|---|
| Open | Lacy Perry L | $169,600 | |
| Closed | Lacy Perry L | $113,952 | |
| Previous Owner | Lambert James E | $10,000 |
Source: Public Records
Tax History Compared to Growth
Tax History
| Year | Tax Paid | Tax Assessment Tax Assessment Total Assessment is a certain percentage of the fair market value that is determined by local assessors to be the total taxable value of land and additions on the property. | Land | Improvement |
|---|---|---|---|---|
| 2025 | $1,209 | $59,411 | $24,850 | $34,561 |
| 2024 | $2,205 | $59,411 | $24,850 | $34,561 |
| 2023 | $860 | $55,584 | $22,400 | $33,184 |
| 2022 | $847 | $52,801 | $22,400 | $30,401 |
| 2021 | $784 | $46,936 | $17,850 | $29,086 |
| 2020 | $725 | $47,248 | $18,200 | $29,048 |
| 2019 | $680 | $42,697 | $14,000 | $28,697 |
| 2018 | $648 | $38,167 | $10,500 | $27,667 |
| 2017 | $1,219 | $37,187 | $9,100 | $28,087 |
| 2016 | $860 | $31,638 | $5,950 | $25,688 |
| 2015 | $854 | $23,456 | $4,200 | $19,256 |
| 2014 | $866 | $17,406 | $2,100 | $15,306 |
Source: Public Records
Map
Nearby Homes
- 2229 Goldhill Way
- 1604 Luning Dr
- 1310 N Tonopah Dr
- 2520 Bottle Palm Ct
- 2624 Feather Cactus Ct
- 2521 Rainbow Cactus Ct
- 2045 Rose Coral Ave
- 2400 Dutchmans Pipe Ct
- 1901 Manhattan Dr
- 2632 Chin Cactus Ct
- 2625 Chin Cactus Ct
- 913 Jade Plant St
- 2508 Ellingson Dr
- 2100 Port Ave
- 1106 Arrowhead Ave
- 2133 Sleepy Ct
- 1103 Arrowhead Ave
- 1920 Hodgenville St Unit 103
- 2211 Sleepy Ct
- 2621 Adelante Ave Unit 104