1324 Pembroke Jones Dr Wilmington, NC 28405
Landfall NeighborhoodEstimated Value: $1,676,900 - $2,087,000
4
Beds
5
Baths
4,326
Sq Ft
$426/Sq Ft
Est. Value
About This Home
This home is located at 1324 Pembroke Jones Dr, Wilmington, NC 28405 and is currently estimated at $1,844,225, approximately $426 per square foot. 1324 Pembroke Jones Dr is a home located in New Hanover County with nearby schools including Wrightsville Beach Elementary School, M.C.S. Noble Middle School, and New Hanover High School.
Ownership History
Date
Name
Owned For
Owner Type
Purchase Details
Closed on
Jul 10, 2004
Sold by
Matthew Reed Builders Llc
Bought by
Yates Ronald L Ann O
Current Estimated Value
Purchase Details
Closed on
Jul 24, 2003
Sold by
Heraeus Quartztech Inc
Bought by
Matthew Reed Builders Llc
Purchase Details
Closed on
Jan 17, 2001
Sold by
Heraeus Amersil Inc
Bought by
Heraeus Quartztech Inc
Purchase Details
Closed on
Apr 1, 1999
Sold by
Wholesale Glass Fabricator Inc
Bought by
Heraeus Amersil Inc
Purchase Details
Closed on
Aug 1, 1988
Sold by
Williams Sara A
Bought by
Wholesale Glass Fabricato
Purchase Details
Closed on
Jun 1, 1986
Sold by
Landfall Associates
Bought by
Williams Junius S Sara A
Purchase Details
Closed on
Jul 1, 1985
Sold by
Landfall Dev Co
Bought by
Landfall Associates
Create a Home Valuation Report for This Property
The Home Valuation Report is an in-depth analysis detailing your home's value as well as a comparison with similar homes in the area
Home Values in the Area
Average Home Value in this Area
Purchase History
| Date | Buyer | Sale Price | Title Company |
|---|---|---|---|
| Yates Ronald L Ann O | $839,000 | -- | |
| Matthew Reed Builders Llc | $82,000 | -- | |
| Heraeus Quartztech Inc | -- | -- | |
| Heraeus Amersil Inc | -- | -- | |
| Wholesale Glass Fabricato | $108,000 | -- | |
| Williams Junius S Sara A | -- | -- | |
| Landfall Associates | -- | -- |
Source: Public Records
Tax History Compared to Growth
Tax History
| Year | Tax Paid | Tax Assessment Tax Assessment Total Assessment is a certain percentage of the fair market value that is determined by local assessors to be the total taxable value of land and additions on the property. | Land | Improvement |
|---|---|---|---|---|
| 2025 | $9,019 | $1,532,500 | $705,200 | $827,300 |
| 2023 | $8,417 | $967,500 | $363,800 | $603,700 |
| 2022 | $8,224 | $967,500 | $363,800 | $603,700 |
| 2021 | $8,280 | $967,500 | $363,800 | $603,700 |
| 2020 | $10,083 | $957,200 | $326,100 | $631,100 |
| 2019 | $10,083 | $957,200 | $326,100 | $631,100 |
| 2018 | $10,083 | $957,200 | $326,100 | $631,100 |
| 2017 | $10,083 | $957,200 | $326,100 | $631,100 |
| 2016 | $10,314 | $930,900 | $197,700 | $733,200 |
| 2015 | $10,232 | $966,200 | $197,700 | $768,500 |
| 2014 | $9,797 | $966,200 | $197,700 | $768,500 |
Source: Public Records
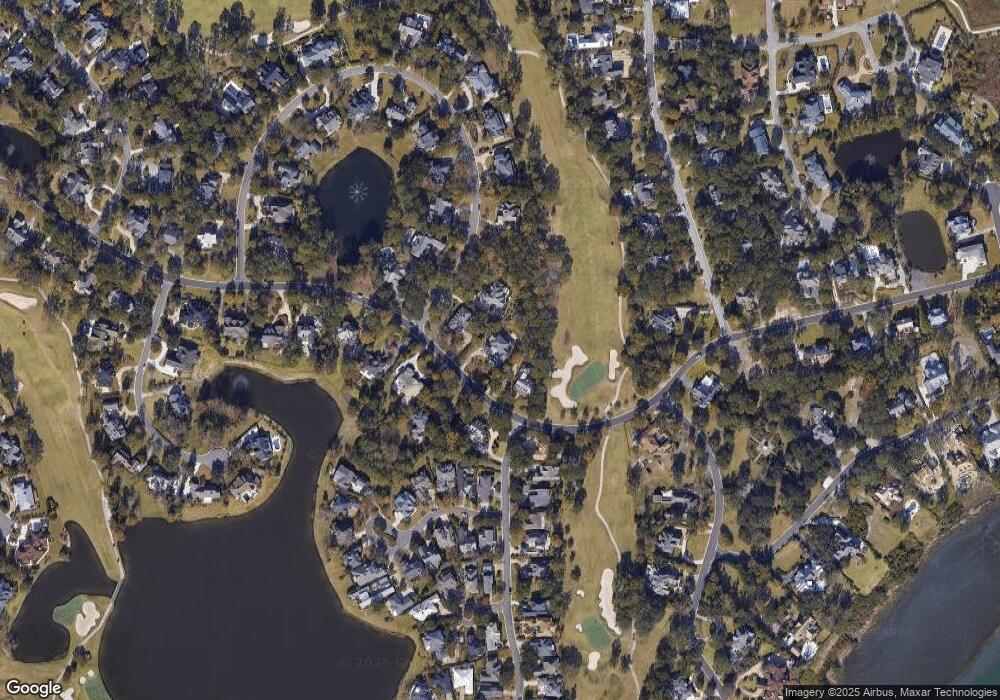
Map
Nearby Homes
- 2005 Northstar Place
- 1453 Quadrant Cir
- 1450 Quadrant Cir
- 1200 Great Oaks Dr
- 2220 Moreland Dr
- 2000 Marsh Harbor Place
- 1104 Shelter Cove Place
- 1913 Prestwick Ln
- 1936 Prestwick Ln
- 1704 Pope Ct
- 1846 Senova Trace
- 2105 Boatswain Place Unit 1717
- 1943 Prestwick Ln
- 1634 Verrazzano Dr
- 1800 Newington Ct
- 1105 Arboretum Dr
- 1905 Staunton Ct
- 120 Beech St
- 1803 Glen Eagles Ln
- 1737 S Moorings Dr
- 1318 Pembroke Jones Dr
- 1400 Quadrant Cir
- 1404 Quadrant Cir
- 1321 Pembroke Jones Dr
- 1329 Pembroke Jones Dr
- 1301 Regatta Dr
- 1403 Quadrant Cir
- 1407 Quadrant Cir
- 1401 Pembroke Jones Dr
- 1325 Pembroke Jones Dr
- 1412 Quadrant Cir
- 1305 Regatta Dr
- 2025 Northstar Place
- 1310 Regatta Dr
- 2021 Northstar Place
- 1413 Quadrant Cir
- 1407 Pembroke Jones Dr
- 1309 Regatta Dr
- 2017 Northstar Place
- 1248 Arboretum Dr