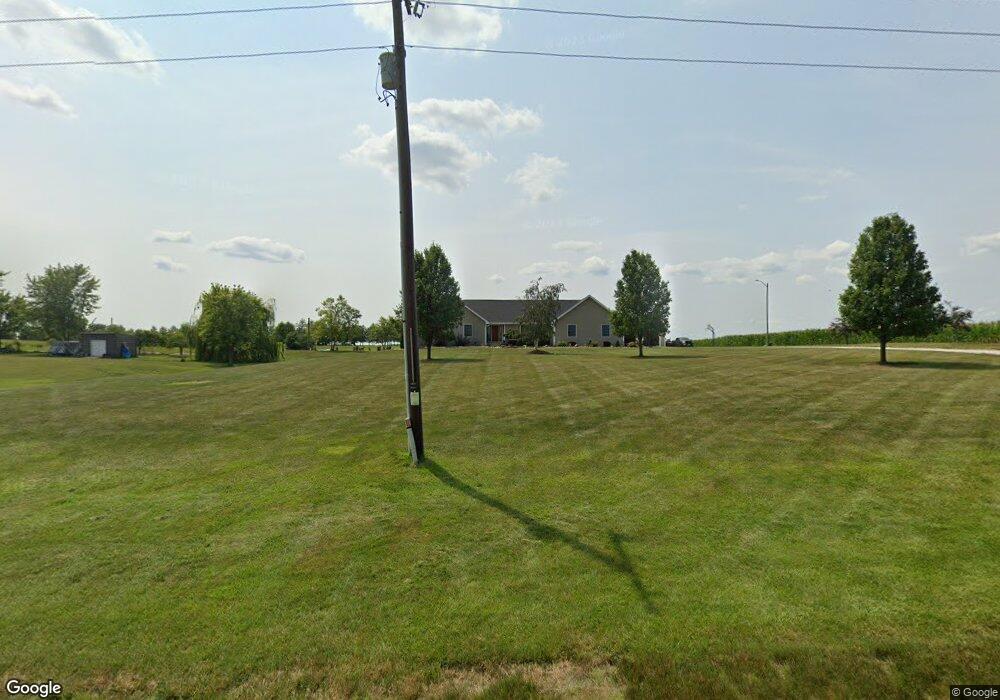
1324 S 900 E Marion, IN 46953
Estimated Value: $352,000 - $501,867
3
Beds
3
Baths
1,722
Sq Ft
$248/Sq Ft
Est. Value
About This Home
This home is located at 1324 S 900 E, Marion, IN 46953 and is currently estimated at $426,289, approximately $247 per square foot. 1324 S 900 E is a home located in Grant County.
Ownership History
Date
Name
Owned For
Owner Type
Purchase Details
Closed on
Aug 21, 2009
Sold by
Howard Charles R and Howard Amy M
Bought by
Bowser Jerad C and Bowser Angela D
Current Estimated Value
Home Financials for this Owner
Home Financials are based on the most recent Mortgage that was taken out on this home.
Original Mortgage
$139,809
Outstanding Balance
$89,604
Interest Rate
5.28%
Mortgage Type
Future Advance Clause Open End Mortgage
Estimated Equity
$336,685
Purchase Details
Closed on
Sep 3, 2005
Sold by
Howard Harry T and Howard Charles R
Bought by
Howard Charles R and Howard Amy M
Purchase Details
Closed on
Jan 30, 2002
Sold by
Not Provided
Bought by
Not Provided
Create a Home Valuation Report for This Property
The Home Valuation Report is an in-depth analysis detailing your home's value as well as a comparison with similar homes in the area
Purchase History
| Date | Buyer | Sale Price | Title Company |
|---|---|---|---|
| Bowser Jerad C | $192,000 | Grant County Abstract Co Inc | |
| Bowser Jerad C | -- | None Available | |
| Howard Charles R | -- | None Available | |
| Not Provided | $20,000 | -- |
Source: Public Records
Mortgage History
| Date | Status | Borrower | Loan Amount |
|---|---|---|---|
| Open | Bowser Jerad C | $139,809 |
Source: Public Records
Tax History
| Year | Tax Paid | Tax Assessment Tax Assessment Total Assessment is a certain percentage of the fair market value that is determined by local assessors to be the total taxable value of land and additions on the property. | Land | Improvement |
|---|---|---|---|---|
| 2025 | $2,331 | $399,000 | $51,100 | $347,900 |
| 2024 | $2,331 | $358,500 | $51,100 | $307,400 |
| 2023 | $2,263 | $325,700 | $51,100 | $274,600 |
| 2022 | $1,885 | $254,900 | $39,500 | $215,400 |
| 2021 | $1,799 | $237,300 | $39,500 | $197,800 |
| 2020 | $1,603 | $227,400 | $37,500 | $189,900 |
| 2019 | $1,465 | $219,700 | $37,500 | $182,200 |
| 2018 | $1,394 | $214,300 | $37,500 | $176,800 |
| 2017 | $1,301 | $213,400 | $37,500 | $175,900 |
| 2016 | $1,256 | $215,900 | $37,500 | $178,400 |
| 2014 | $1,207 | $206,900 | $37,500 | $169,400 |
| 2013 | $1,207 | $223,000 | $37,500 | $185,500 |
Source: Public Records
Map
Nearby Homes
- 0 E 200 S Unit 202601439
- 1864 S 700 E
- 1270 S 600 E
- 9810 E 400 S
- 6004 E 200 S
- 8219 E 100 S
- 300 E S
- 2804 N 800 E
- Lot 8 W South St
- Lot 7 W South St
- Lot 9 W South St
- 328 W Jefferson St
- 4432 E 200 S
- 776 W Harsax Dr
- 0183 W State Road 18
- 0 County Road 425 S
- 6231 E 600 S
- 8885 E 400 N
- 9964 E 400 N
- 66 Cobblestone Blvd
Your Personal Tour Guide
Ask me questions while you tour the home.