1324 Thornbird Dr Cincinnati, OH 45230
Salem Heights NeighborhoodEstimated Value: $507,000 - $692,000
4
Beds
4
Baths
3,411
Sq Ft
$183/Sq Ft
Est. Value
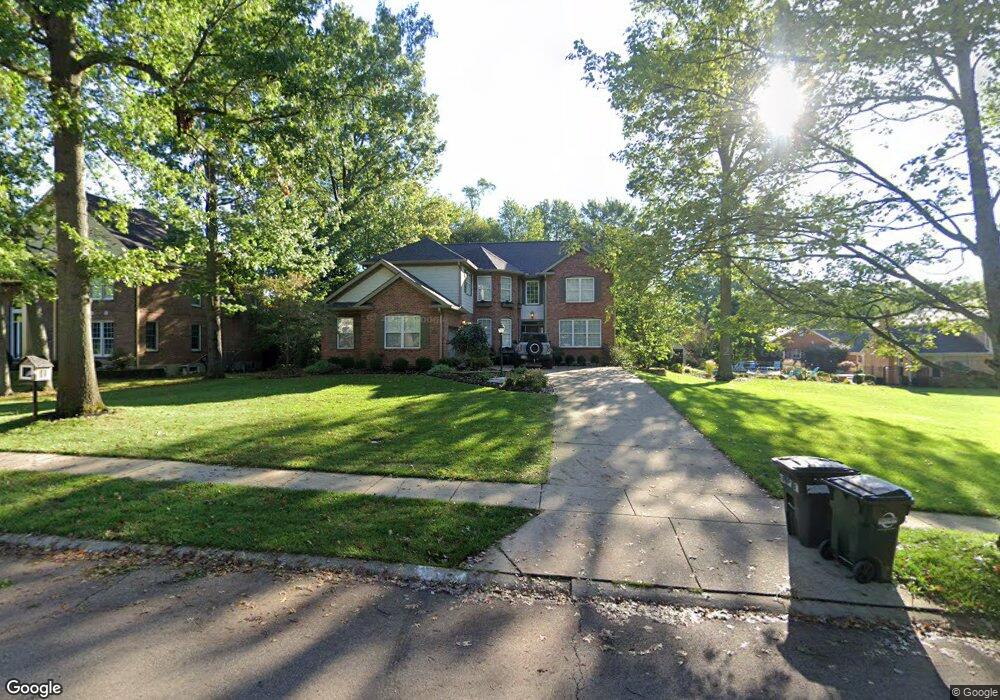
About This Home
This home is located at 1324 Thornbird Dr, Cincinnati, OH 45230 and is currently estimated at $624,345, approximately $183 per square foot. 1324 Thornbird Dr is a home located in Hamilton County with nearby schools including Maddux Elementary School, Nagel Middle School, and Anderson High School.
Ownership History
Date
Name
Owned For
Owner Type
Purchase Details
Closed on
Aug 28, 2008
Sold by
Peters Christopher K and Peters Amy L
Bought by
Peters Amy L and Peters Christopher K
Current Estimated Value
Purchase Details
Closed on
Mar 28, 2003
Sold by
Heath Lynn A Trs
Bought by
Peters Christopher K and Peters Amy L
Purchase Details
Closed on
May 6, 1999
Sold by
Heath R Scott and Heath Lynn A
Bought by
Heath Lynn A and Scott Heath R
Create a Home Valuation Report for This Property
The Home Valuation Report is an in-depth analysis detailing your home's value as well as a comparison with similar homes in the area
Home Values in the Area
Average Home Value in this Area
Purchase History
| Date | Buyer | Sale Price | Title Company |
|---|---|---|---|
| Peters Amy L | -- | Attorney | |
| Peters Christopher K | $73,000 | First Title Agency Inc | |
| Heath Lynn A | -- | -- |
Source: Public Records
Tax History Compared to Growth
Tax History
| Year | Tax Paid | Tax Assessment Tax Assessment Total Assessment is a certain percentage of the fair market value that is determined by local assessors to be the total taxable value of land and additions on the property. | Land | Improvement |
|---|---|---|---|---|
| 2024 | $11,102 | $182,529 | $30,107 | $152,422 |
| 2023 | $10,555 | $182,529 | $30,107 | $152,422 |
| 2022 | $10,502 | $161,763 | $31,311 | $130,452 |
| 2021 | $10,261 | $161,763 | $31,311 | $130,452 |
| 2020 | $10,370 | $161,763 | $31,311 | $130,452 |
| 2019 | $10,984 | $155,540 | $30,107 | $125,433 |
| 2018 | $10,289 | $155,540 | $30,107 | $125,433 |
| 2017 | $9,708 | $155,540 | $30,107 | $125,433 |
| 2016 | $9,265 | $144,974 | $30,713 | $114,261 |
| 2015 | $8,995 | $144,974 | $30,713 | $114,261 |
| 2014 | $9,001 | $144,974 | $30,713 | $114,261 |
| 2013 | $8,346 | $142,132 | $30,111 | $112,021 |
Source: Public Records
Map
Nearby Homes
- 1336 Thornbird Dr
- 6170 Woodlark Dr
- 1360 Thornbird Dr
- 6176 Woodlark Dr
- 1364 Thornbird Dr
- 292 Thornbird Dr Unit L292
- 6160 Woodlark Dr
- 6178 Woodlark Dr
- 1331 Thornbird Dr
- 1368 Thornbird Dr
- 6180 Woodlark Dr
- 1339 Thornbird Dr
- 1343 Thornbird Dr
- 6154 Woodlark Dr
- Lot-7 Whitney Ln
- 1372 Thornbird Dr
- 1359 Thornbird Dr
- 1349 Thornbird Dr
- 6175 Woodlark Dr
- 6169 Woodlark Dr