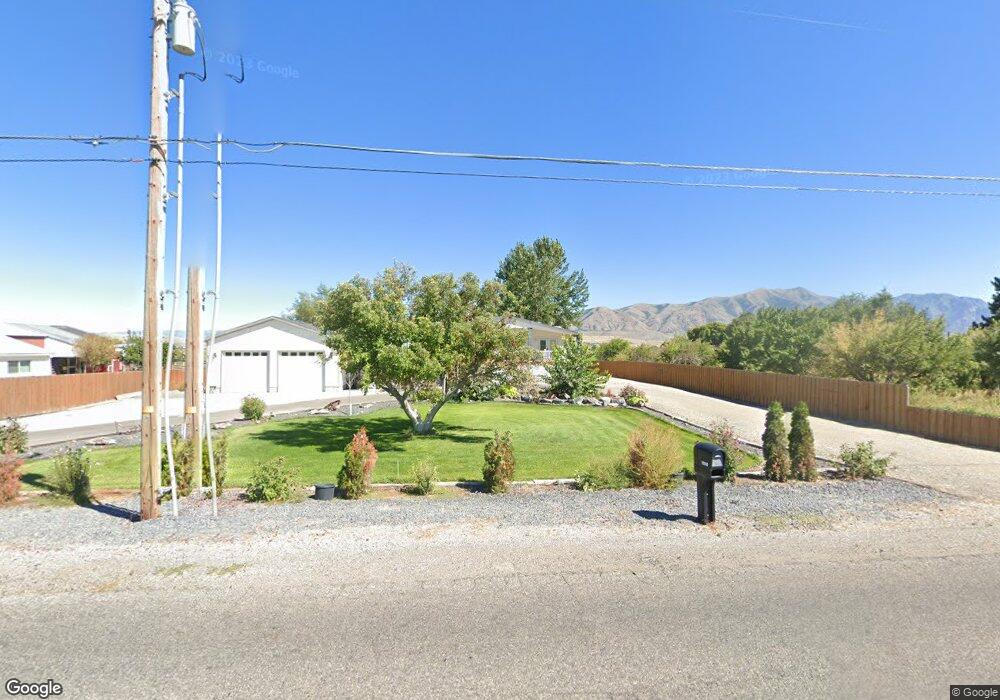
13240 N 6000 W Garland, UT 84312
Estimated Value: $489,000 - $606,000
--
Bed
--
Bath
2,018
Sq Ft
$264/Sq Ft
Est. Value
About This Home
This home is located at 13240 N 6000 W, Garland, UT 84312 and is currently estimated at $533,590, approximately $264 per square foot. 13240 N 6000 W is a home located in Box Elder County with nearby schools including Fielding School, Bear River Middle School, and Alice C. Harris Intermediate School.
Ownership History
Date
Name
Owned For
Owner Type
Purchase Details
Closed on
Jun 4, 2021
Sold by
Wood Apple Farm Llc
Bought by
Wood Richard Jay and Garner Lori Ann
Current Estimated Value
Home Financials for this Owner
Home Financials are based on the most recent Mortgage that was taken out on this home.
Original Mortgage
$80,300
Outstanding Balance
$72,702
Interest Rate
2.9%
Mortgage Type
Commercial
Estimated Equity
$460,888
Create a Home Valuation Report for This Property
The Home Valuation Report is an in-depth analysis detailing your home's value as well as a comparison with similar homes in the area
Home Values in the Area
Average Home Value in this Area
Purchase History
| Date | Buyer | Sale Price | Title Company |
|---|---|---|---|
| Wood Richard Jay | -- | American Secure Ttl Tremonto |
Source: Public Records
Mortgage History
| Date | Status | Borrower | Loan Amount |
|---|---|---|---|
| Open | Wood Richard Jay | $80,300 |
Source: Public Records
Tax History Compared to Growth
Tax History
| Year | Tax Paid | Tax Assessment Tax Assessment Total Assessment is a certain percentage of the fair market value that is determined by local assessors to be the total taxable value of land and additions on the property. | Land | Improvement |
|---|---|---|---|---|
| 2025 | $2,590 | $549,607 | $135,000 | $414,607 |
| 2024 | $2,590 | $555,431 | $135,000 | $420,431 |
| 2023 | $2,619 | $566,748 | $135,000 | $431,748 |
| 2022 | $2,294 | $257,848 | $16,500 | $241,348 |
| 2021 | $1,930 | $286,395 | $30,000 | $256,395 |
| 2020 | $1,613 | $286,395 | $30,000 | $256,395 |
| 2019 | $1,505 | $141,294 | $16,500 | $124,794 |
| 2018 | $1,131 | $101,233 | $16,500 | $84,733 |
| 2017 | $1,194 | $184,060 | $16,500 | $154,060 |
| 2016 | $1,138 | $97,198 | $16,500 | $80,698 |
| 2015 | $1,024 | $89,862 | $16,500 | $73,362 |
| 2014 | $1,024 | $86,369 | $16,500 | $69,869 |
| 2013 | -- | $85,207 | $15,338 | $69,869 |
Source: Public Records
Map
Nearby Homes