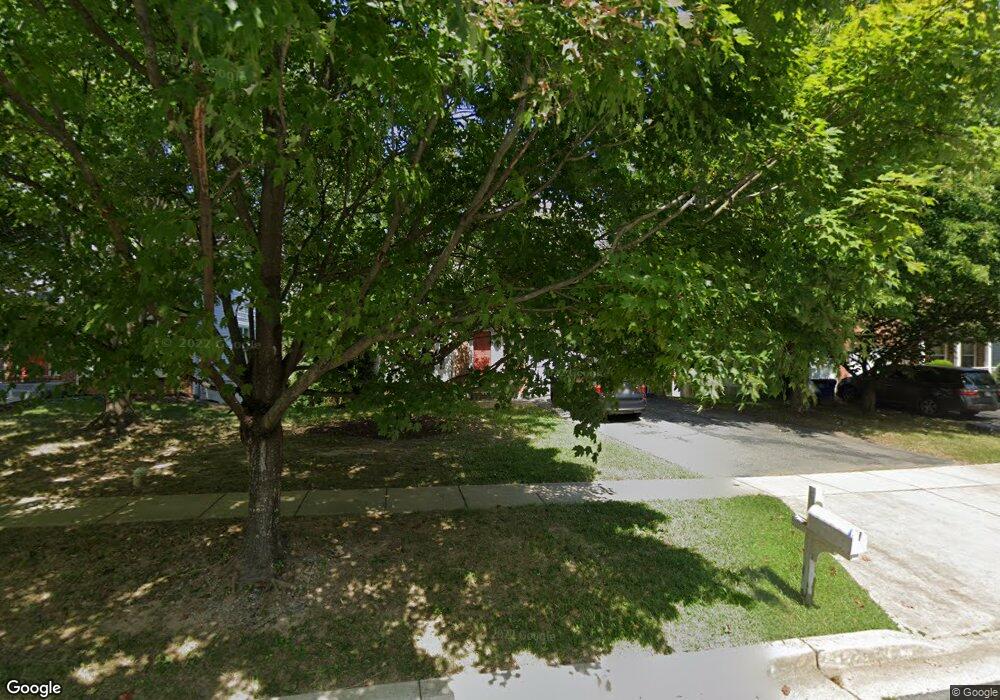
13245 Trebleclef Ln Silver Spring, MD 20904
Estimated Value: $499,000 - $703,000
Studio
3
Baths
2,564
Sq Ft
$236/Sq Ft
Est. Value
About This Home
This home is located at 13245 Trebleclef Ln, Silver Spring, MD 20904 and is currently estimated at $604,425, approximately $235 per square foot. 13245 Trebleclef Ln is a home located in Montgomery County with nearby schools including Galway Elementary School, Briggs Chaney Middle School, and Paint Branch High School.
Ownership History
Date
Name
Owned For
Owner Type
Purchase Details
Closed on
Aug 27, 2018
Sold by
Ayendi Anyama Jacqueline and Ayendi Janet Afebanye
Bought by
Ayendi Anyama Jacqueline and Ayendi Janet Afebanye
Current Estimated Value
Home Financials for this Owner
Home Financials are based on the most recent Mortgage that was taken out on this home.
Original Mortgage
$296,601
Interest Rate
4.8%
Mortgage Type
FHA
Purchase Details
Closed on
Oct 20, 2016
Sold by
State Highway Administration Of The
Bought by
Ayendi Janet Afebanye and Ayendi Mathias
Home Financials for this Owner
Home Financials are based on the most recent Mortgage that was taken out on this home.
Original Mortgage
$295,075
Interest Rate
4.21%
Mortgage Type
FHA
Purchase Details
Closed on
Feb 21, 2008
Sold by
Yang Tzung and Yang Chen
Bought by
State Of Maryland To The Use Of and State Highway Admin
Create a Home Valuation Report for This Property
The Home Valuation Report is an in-depth analysis detailing your home's value as well as a comparison with similar homes in the area
Home Values in the Area
Average Home Value in this Area
Purchase History
| Date | Buyer | Sale Price | Title Company |
|---|---|---|---|
| Ayendi Anyama Jacqueline | -- | Strategic National Title Gro | |
| Ayendi Janet Afebanye | $283,000 | Michaels Ttile & Escrow Llc | |
| State Of Maryland To The Use Of | $530,000 | -- |
Source: Public Records
Mortgage History
| Date | Status | Borrower | Loan Amount |
|---|---|---|---|
| Previous Owner | Ayendi Anyama Jacqueline | $296,601 | |
| Previous Owner | Ayendi Janet Afebanye | $295,075 |
Source: Public Records
Tax History
| Year | Tax Paid | Tax Assessment Tax Assessment Total Assessment is a certain percentage of the fair market value that is determined by local assessors to be the total taxable value of land and additions on the property. | Land | Improvement |
|---|---|---|---|---|
| 2025 | $5,142 | $433,933 | -- | -- |
| 2024 | $5,142 | $407,767 | $0 | $0 |
| 2023 | $5,382 | $381,600 | $224,300 | $157,300 |
| 2022 | $3,739 | $375,467 | $0 | $0 |
| 2021 | $3,625 | $369,333 | $0 | $0 |
| 2020 | $3,538 | $363,200 | $224,300 | $138,900 |
| 2019 | $3,526 | $363,200 | $224,300 | $138,900 |
| 2018 | $3,781 | $363,200 | $224,300 | $138,900 |
| 2017 | $4,196 | $367,700 | $0 | $0 |
| 2016 | -- | $367,700 | $0 | $0 |
| 2015 | -- | $367,700 | $0 | $0 |
| 2014 | -- | $385,300 | $0 | $0 |
Source: Public Records
Map
Nearby Homes
- 2863 Strauss Terrace
- 13122 Musicmaster Dr
- 13115 Musicmaster Dr
- 3030 Piano Ln
- 2807 Strauss Terrace
- 3013 Piano Ln
- 13233 Copland Ct
- 3024 Memory Ln
- 2971 Shepperton Terrace
- 3055 Shepperton Terrace
- 2861 Shepperton Terrace
- 3006 Shepperton Terrace
- 2819 Shepperton Terrace
- 2704 Martello Dr
- 3301 Sir Thomas Dr
- 3301 Sir Thomas Dr Unit 6B34
- 2702 Martello Dr
- 13408 Shady Knoll Dr Unit 308
- 12705 Hawkshead Terrace
- 13014 English Turn Dr
- 13241 Trebleclef Ln
- 13249 Trebleclef Ln
- 13249#Basement Trebleclef Ln
- 13237 Trebleclef Ln
- 13233 Trebleclef Ln
- 13240 Trebleclef Ln
- 13244 Trebleclef Ln
- 13238 Trebleclef Ln
- 13248 Trebleclef Ln
- 13234 Trebleclef Ln
- 13229 Trebleclef Ln
- 13252 Trebleclef Ln
- 13230 Trebleclef Ln
- 13221 Schubert Place
- 13256 Trebleclef Ln
- 13225 Schubert Place
- 13225 Trebleclef Ln
- 13217 Schubert Place
- 13224 Trebleclef Ln
- 2946 Strauss Terrace
Your Personal Tour Guide
Ask me questions while you tour the home.