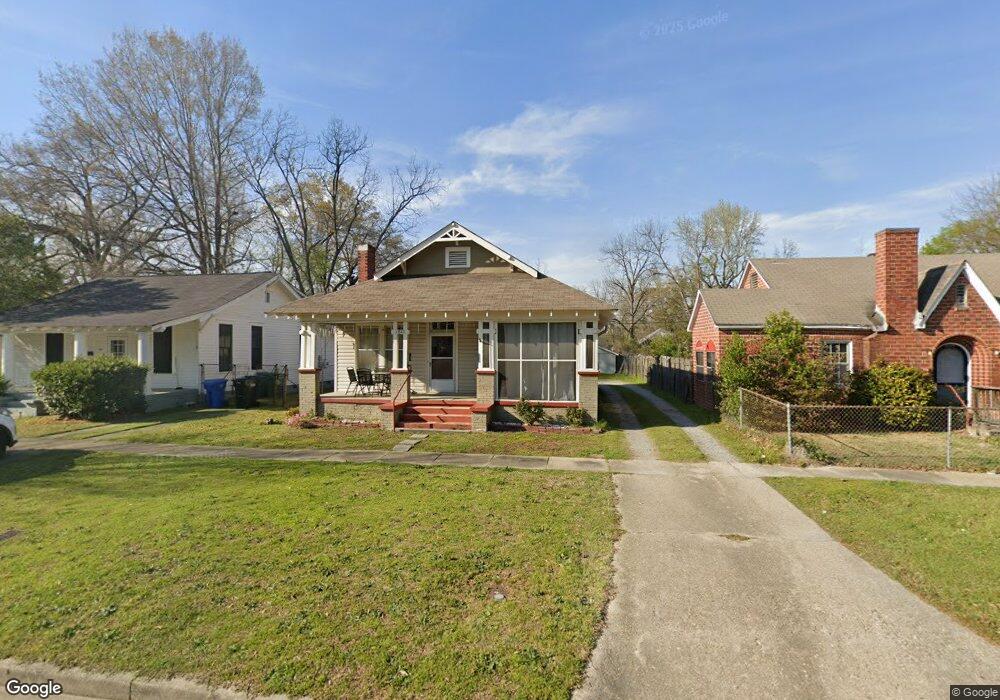
1325 21st St Columbus, GA 31901
East Highlands NeighborhoodEstimated Value: $125,000 - $166,000
2
Beds
2
Baths
1,170
Sq Ft
$127/Sq Ft
Est. Value
About This Home
This home is located at 1325 21st St, Columbus, GA 31901 and is currently estimated at $148,619, approximately $127 per square foot. 1325 21st St is a home located in Muscogee County with nearby schools including Arnold Middle School, Jordan Vocational High School, and Wynnton Elementary School.
Ownership History
Date
Name
Owned For
Owner Type
Purchase Details
Closed on
Jun 8, 2023
Sold by
Williams Nias Ambrosia
Bought by
Webb Adelfa
Current Estimated Value
Purchase Details
Closed on
Jun 1, 2017
Sold by
Cantrell Brandon
Bought by
Webb Michael Travis and Williams Nias Ambrosia
Home Financials for this Owner
Home Financials are based on the most recent Mortgage that was taken out on this home.
Original Mortgage
$78,452
Interest Rate
3.62%
Mortgage Type
FHA
Purchase Details
Closed on
Jul 18, 2014
Sold by
Reynolds Michael D
Bought by
Cantrell Brandon
Create a Home Valuation Report for This Property
The Home Valuation Report is an in-depth analysis detailing your home's value as well as a comparison with similar homes in the area
Home Values in the Area
Average Home Value in this Area
Purchase History
| Date | Buyer | Sale Price | Title Company |
|---|---|---|---|
| Webb Adelfa | -- | None Listed On Document | |
| Webb Michael Travis | $79,900 | -- | |
| Cantrell Brandon | $45,000 | -- |
Source: Public Records
Mortgage History
| Date | Status | Borrower | Loan Amount |
|---|---|---|---|
| Previous Owner | Webb Michael Travis | $78,452 |
Source: Public Records
Tax History Compared to Growth
Tax History
| Year | Tax Paid | Tax Assessment Tax Assessment Total Assessment is a certain percentage of the fair market value that is determined by local assessors to be the total taxable value of land and additions on the property. | Land | Improvement |
|---|---|---|---|---|
| 2025 | $1,068 | $57,028 | $7,756 | $49,272 |
| 2024 | $1,067 | $57,028 | $7,756 | $49,272 |
| 2023 | $379 | $57,028 | $7,756 | $49,272 |
| 2022 | $1,112 | $44,940 | $7,756 | $37,184 |
| 2021 | $758 | $36,440 | $7,756 | $28,684 |
| 2020 | $759 | $36,440 | $7,756 | $28,684 |
| 2019 | $763 | $36,440 | $7,756 | $28,684 |
| 2018 | $763 | $31,960 | $6,800 | $25,160 |
| 2017 | $1,498 | $36,440 | $7,756 | $28,684 |
| 2016 | $743 | $18,000 | $2,600 | $15,400 |
| 2015 | $743 | $18,000 | $2,600 | $15,400 |
| 2014 | $315 | $19,026 | $2,600 | $16,426 |
| 2013 | -- | $19,026 | $2,600 | $16,426 |
Source: Public Records
Map
Nearby Homes