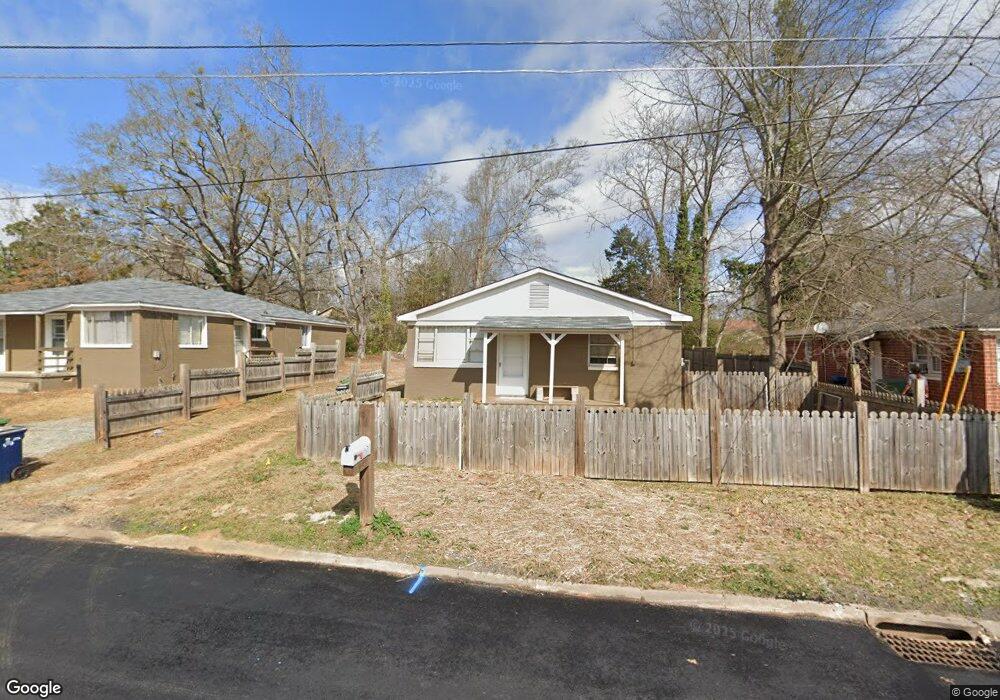
1325 Drewery Ave Griffin, GA 30223
Spalding County NeighborhoodEstimated Value: $103,468 - $155,000
2
Beds
1
Bath
1,008
Sq Ft
$128/Sq Ft
Est. Value
About This Home
This home is located at 1325 Drewery Ave, Griffin, GA 30223 and is currently estimated at $128,867, approximately $127 per square foot. 1325 Drewery Ave is a home located in Spalding County with nearby schools including Orrs Elementary School, Carver Road Middle School, and Griffin High School.
Ownership History
Date
Name
Owned For
Owner Type
Purchase Details
Closed on
Oct 27, 2015
Sold by
Stojek Raymond
Bought by
Rawlings Randall B
Current Estimated Value
Purchase Details
Closed on
Oct 23, 2015
Sold by
Beam Sheila Ann
Bought by
Stojek Raymond
Purchase Details
Closed on
Sep 18, 2015
Sold by
Whidby Carolyn Darlene
Bought by
Stojek Raymond
Purchase Details
Closed on
Sep 18, 1971
Sold by
Woodruff Brenda C
Bought by
Whidby Melvin E
Purchase Details
Closed on
Mar 27, 1970
Sold by
Woodruff Marshall and Woodruff Brenda
Bought by
Woodruff Brenda C
Purchase Details
Closed on
May 24, 1969
Sold by
Beam Wayne and Shiela Ann
Bought by
Woodruff Marshall and Woodruff Brenda
Purchase Details
Closed on
Aug 18, 1967
Sold by
Beam Wayne
Bought by
Beam Wayne and Beam Shiela
Purchase Details
Closed on
Jul 17, 1967
Sold by
Kendrick C A
Bought by
Beam Wayne
Purchase Details
Closed on
Sep 8, 1945
Bought by
Kendrick C A
Create a Home Valuation Report for This Property
The Home Valuation Report is an in-depth analysis detailing your home's value as well as a comparison with similar homes in the area
Home Values in the Area
Average Home Value in this Area
Purchase History
| Date | Buyer | Sale Price | Title Company |
|---|---|---|---|
| Rawlings Randall B | $15,000 | -- | |
| Stojek Raymond | -- | -- | |
| Stojek Raymond | -- | -- | |
| Whidby Melvin E | $1,300 | -- | |
| Woodruff Brenda C | -- | -- | |
| Woodruff Marshall | $8,500 | -- | |
| Beam Wayne | -- | -- | |
| Beam Wayne | $9,900 | -- | |
| Kendrick C A | -- | -- |
Source: Public Records
Tax History Compared to Growth
Tax History
| Year | Tax Paid | Tax Assessment Tax Assessment Total Assessment is a certain percentage of the fair market value that is determined by local assessors to be the total taxable value of land and additions on the property. | Land | Improvement |
|---|---|---|---|---|
| 2024 | $544 | $14,237 | $4,320 | $9,917 |
| 2023 | $544 | $14,237 | $4,320 | $9,917 |
| 2022 | $460 | $11,514 | $2,880 | $8,634 |
| 2021 | $428 | $10,711 | $2,880 | $7,831 |
| 2020 | $428 | $10,711 | $2,880 | $7,831 |
| 2019 | $436 | $10,711 | $2,880 | $7,831 |
| 2018 | $414 | $9,805 | $2,880 | $6,925 |
| 2017 | $405 | $9,805 | $2,880 | $6,925 |
| 2016 | $252 | $10,266 | $2,880 | $7,386 |
| 2015 | $438 | $10,266 | $2,880 | $7,386 |
| 2014 | $470 | $10,687 | $2,880 | $7,807 |
Source: Public Records
Map
Nearby Homes
- 602 Melrose Ave
- 2 Cedar Ave
- 1017 Lake Ave
- 1024 Lake Ave
- 124 Ohoopee Dr
- 65 Elm St
- 116 Peachtree St
- 417 N 16th St
- 1102 Thompson St
- 306 Louise Ln Unit A
- 121 Peachtree St
- 354 N 17th St
- 1223 W Broad St
- 202 Cheatham St
- 1206 Hillwood Ave
- 1126 Wright St
- 203 Hillside Cir
- 318 N 15th St
- 1106 Wright St
- 1391 Experiment St Unit 12
- 1321 Drewery Ave
- 1329 Drewery Ave
- 1329 Drewery Ave Unit B
- 1319 Drewery Ave
- 1324 Herndon St
- 1320 Herndon St
- 1336 Herndon St
- 1315 Drewery Ave
- 1312 Herndon St
- 1324 Drewry Ave
- 1332 Herndon St
- 1328 Drewery Ave
- 1332 Drewery Ave
- 0 Drewry Ave Unit 8830742
- 0 Drewry Ave Unit 8690146
- 0 Drewry Ave Unit 8030960
- 0 Drewry Ave Unit 7240790
- 0 Drewry Ave Unit 7240733
- 0 Drewry Ave Unit 7240821
- 621 Drewry Ave