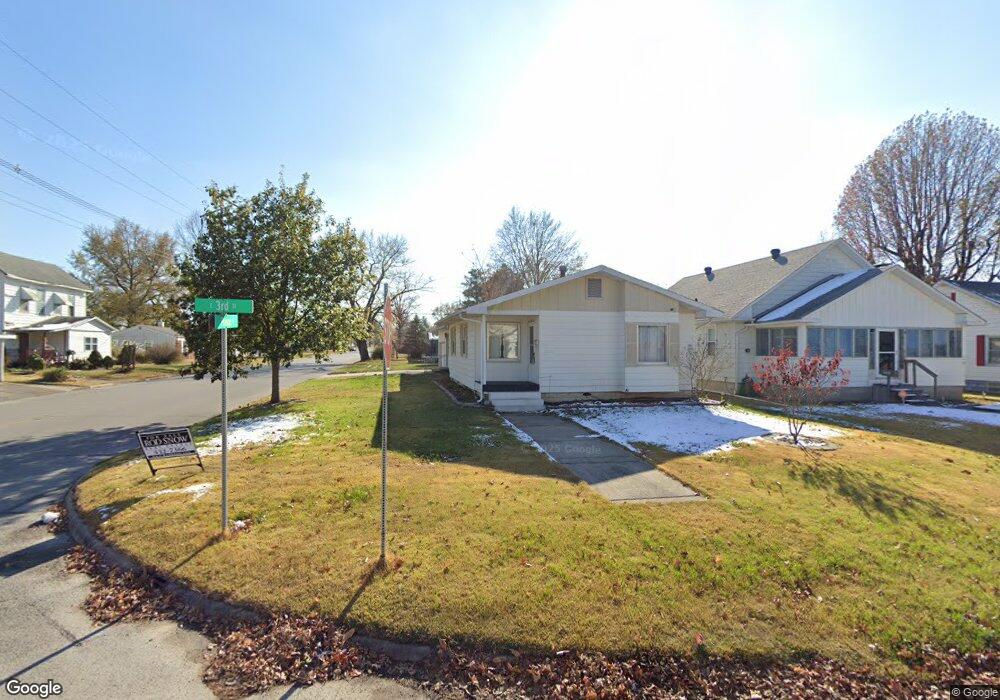
1325 E 3rd St Centralia, IL 62801
Estimated Value: $85,780 - $122,000
3
Beds
1
Bath
1,240
Sq Ft
$85/Sq Ft
Est. Value
About This Home
This home is located at 1325 E 3rd St, Centralia, IL 62801 and is currently estimated at $105,195, approximately $84 per square foot. 1325 E 3rd St is a home located in Marion County with nearby schools including Centralia High School, St. Mary School, and Trinity Lutheran School.
Ownership History
Date
Name
Owned For
Owner Type
Purchase Details
Closed on
Sep 28, 2009
Sold by
Smith April Lynn
Bought by
Straith Christopher W
Current Estimated Value
Home Financials for this Owner
Home Financials are based on the most recent Mortgage that was taken out on this home.
Original Mortgage
$50,000
Outstanding Balance
$14,952
Interest Rate
5.38%
Mortgage Type
New Conventional
Estimated Equity
$90,243
Purchase Details
Closed on
Apr 9, 2009
Sold by
Us Bank Na
Bought by
Smith April Lynn
Purchase Details
Closed on
Jan 29, 2009
Sold by
Crabtree Robert
Bought by
Us Bank Na
Purchase Details
Closed on
Jun 14, 2005
Sold by
Logan Kim E and Logan Lanna Kay
Bought by
Crabtree Robert and Crabtree Phyllis
Home Financials for this Owner
Home Financials are based on the most recent Mortgage that was taken out on this home.
Original Mortgage
$40,500
Interest Rate
8.35%
Mortgage Type
Adjustable Rate Mortgage/ARM
Create a Home Valuation Report for This Property
The Home Valuation Report is an in-depth analysis detailing your home's value as well as a comparison with similar homes in the area
Home Values in the Area
Average Home Value in this Area
Purchase History
| Date | Buyer | Sale Price | Title Company |
|---|---|---|---|
| Straith Christopher W | $32,000 | Larimer Abstract & Title | |
| Smith April Lynn | $13,500 | None Available | |
| Us Bank Na | -- | None Available | |
| Crabtree Robert | $45,000 | None Available |
Source: Public Records
Mortgage History
| Date | Status | Borrower | Loan Amount |
|---|---|---|---|
| Open | Straith Christopher W | $50,000 | |
| Previous Owner | Crabtree Robert | $40,500 |
Source: Public Records
Tax History
| Year | Tax Paid | Tax Assessment Tax Assessment Total Assessment is a certain percentage of the fair market value that is determined by local assessors to be the total taxable value of land and additions on the property. | Land | Improvement |
|---|---|---|---|---|
| 2024 | $1,683 | $21,620 | $2,340 | $19,280 |
| 2023 | $1,737 | $20,210 | $2,190 | $18,020 |
| 2022 | $1,146 | $18,370 | $1,990 | $16,380 |
| 2021 | $1,098 | $17,170 | $1,860 | $15,310 |
| 2020 | $1,066 | $16,660 | $1,810 | $14,850 |
| 2019 | $1,023 | $16,050 | $1,740 | $14,310 |
| 2018 | $1,040 | $16,050 | $1,740 | $14,310 |
| 2017 | $1,025 | $15,740 | $1,710 | $14,030 |
| 2016 | $1,011 | $15,130 | $1,640 | $13,490 |
| 2015 | $10 | $15,130 | $1,640 | $13,490 |
| 2012 | $9 | $14,830 | $1,600 | $13,230 |
Source: Public Records
Map
Nearby Homes
- 1023 E Broadway
- 1201 E Noleman St
- 1025 E Noleman St
- 23 Park Ln
- 0 Frazier Ave
- 1740 Frazier Ave
- 521 Marquis Ave
- 00 Illinois 161
- 1340 E 6th St
- 433 Linden Ave
- 8 Ronnies Terrace
- 242 Watson St
- 122 E Calumet St
- 640 Meadowbrook Ln
- 4 Lilac Ln
- 838 E 2nd St Unit 846
- 11 Ridge Rd
- 334 S Lincoln Blvd
- 16 Edgewood Ln S
- 525 Kristy Dr
- 1323 E 3rd St
- 1321 E 3rd St
- 1405 E 3rd St
- 307 S Pleasant Ave
- 314 S Pleasant Ave
- 1307 E 3rd St
- 311 S Pleasant Ave
- 1409 E 3rd St
- 1301 E 3rd St
- 1314 E 3rd St
- 317 S Davis Ave
- 1310 E 3rd St
- 315 S Pleasant Ave
- 1415 E 3rd St
- 1308 E 3rd St
- 319 S Davis Ave
- 1410 E 4th St
- 325 S Davis Ave
- 1306 E 3rd St
- 1416 E 4th St
Your Personal Tour Guide
Ask me questions while you tour the home.